7 Most Important Customer Service Metrics to Track in 2026

BlueTweak is an AI Customer Support Platform that unifies every conversation, customer record, and automation into one workspace.
Explore more
Insights, trends, and practical ideas from customer experience and AI
Real-world scenarios showing how teams use BlueTweak to deliver better service
The daily blueprint that guides customer support leadership.
ROI and savings calculators for support teams
See how BlueTweak stacks up against leading customer support platforms
The best customer support metrics in 2026 focus on what actually moves customer experience and operational costs. These metrics provide valuable insights into service quality, customer loyalty, and areas for continuous improvement. Measure them by intent, channel, and segment, then use the data to improve customer service performance and drive targeted improvements.
If you’re tracking dozens of customer service metrics but still don’t know what’s actually broken in your support operations, you’re not alone. Most customer service teams drown in dashboards that show everything but reveal nothing.
Quality is more important than quantity.
Ultimately, only a handful of customer support metrics matter in 2026. These are the key performance indicators (KPIs) that directly impact customer satisfaction, operational costs, and customer retention.
Everything else is just noise.
Most teams we talk to are tracking 20 or 30 metrics, but when you ask them what they actually changed last quarter based on that data, the room goes quiet. FCR and CSAT, measured at the intent and channel level, tell you more about where your support operation is breaking down than any dashboard full of averages ever will.
Radu Dumitrescu, Head of Presale & Digital Transformation, BlueTweak
| Traditional KPI | 2026 Modern Priority | Why the Shift? |
| First Response Time | Instant AI Resolution | Customers don’t want a “hello,” they want an answer. |
| Average Handle Time | Orchestration Speed | High AHT is fine for complex cases; bots handle the rest. |
| Ticket Volume | Deflection Quality | We measure “solved without a human,” not just “volume.” |
This guide covers the most critical customer service metrics for measuring performance, identifying areas for improvement, and helping you consistently meet customer expectations. We break down what you should measure, why it matters, and how to use customer service data and contact centre software to drive continuous improvement.
Customer expectations continue to rise. Customers want fast responses, personalized support, and effortless resolutions across every channel. When you fail to meet those expectations, customers go to your competitors.
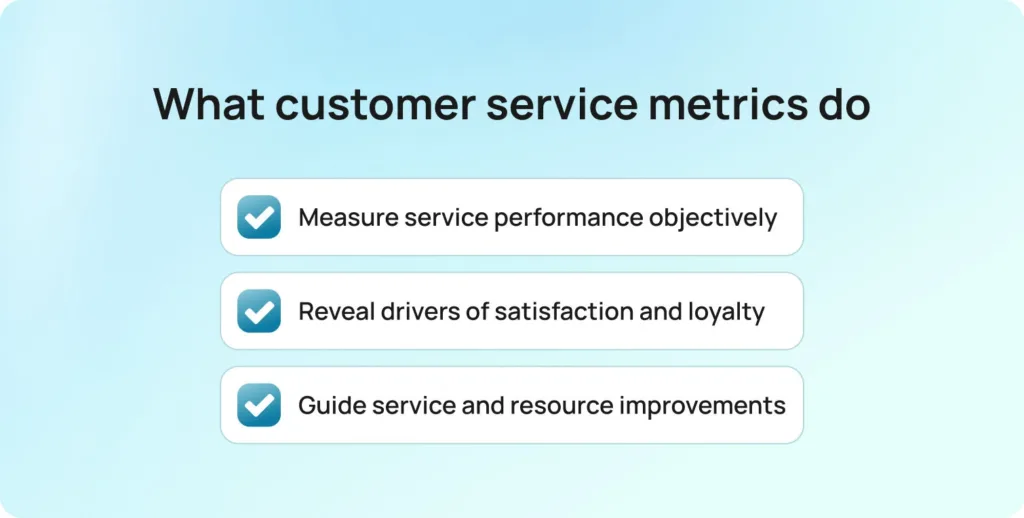
The top customer service metrics do three things:
When you measure customer service metrics correctly, you can resolve customer issues faster, enhance customer satisfaction, and reduce customer churn before it impacts your bottom line.
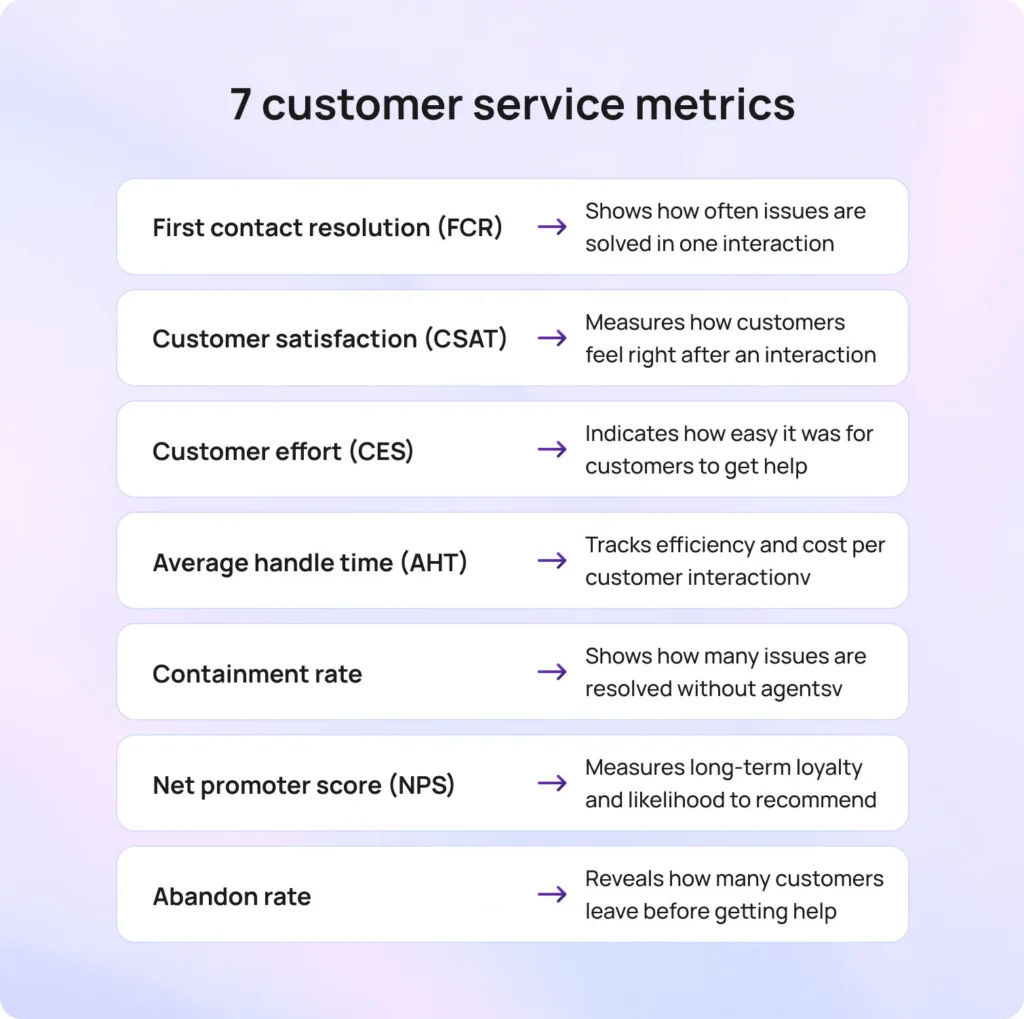
When you strip away vanity metrics, seven fundamentals indicate whether support is healthy, scalable, and improving. They connect what customers feel to what your team does and what it costs. Use them to identify bottlenecks, optimize workflows, and determine where AI and humans each add the most value.
First Contact Resolution (FCR) tracks the percentage of customer inquiries resolved on the first interaction. That means no follow-up calls, emails, or chats needed. The contact resolution rate measures how often customers have their issues resolved without needing to return.
FCR directly impacts both customer satisfaction and operational costs. When you resolve customer issues on the first contact, customers are happier, your customer service team handles fewer repeat tickets, and your cost per resolution drops.
Everyone wins.
A high FCR indicates that your customer service agents have the right information, tools, and authority to resolve issues promptly. Low FCR indicates gaps in your knowledge base, training, or routing logic.
Calculate FCR by dividing the number of issues resolved on first contact by total customer interactions, then multiplying by 100. Break it down by channel (voice, chat, email), intent (returns, billing, technical), and agent to identify patterns.
First contact resolution rate affects nearly every other metric: when FCR rises, Average Handle Time drops, customer satisfaction increases, and customer churn decreases.
BlueTweak tracks FCR by intent, channel, and segment in customer service analytics to help you identify precisely where contact resolution breaks down.
Customer Satisfaction Score (CSAT) measures how satisfied customers are with a specific interaction or overall experience. It’s typically measured through post-interaction surveys that ask, “How satisfied were you with your experience?” on a 1–5 scale.
CSAT is the most direct measure of whether your efforts are meeting customer expectations. It shows how customers feel immediately after an interaction (when sentiment is freshest).
Measuring performance through CSAT lets you gauge customer satisfaction at the interaction level instead of overall brand sentiment. This helps you identify which customer service agents, intents, or channels drive satisfied customers versus those that create friction.
Calculate the customer satisfaction score by dividing the number of positive responses (4 or 5 on a 5-point scale) by total responses, then multiplying by 100. Track CSAT across channels, intents, and customer segments to spot patterns.
Outstanding customer service consistently delivers CSAT scores above 85%. Anything below 75% signals problems that need attention.
BlueTweak’s customer service solution integrates customer satisfaction surveys directly into support workflows, enabling real-time collection and action on customer feedback.
Here’s how one company used BlueTweak to turn CSAT and quality metrics into measurable improvements: Transforming Quality and Customer Satisfaction with BlueTweak in the Packaging Industry
Customer Effort Score (CES) measures how easy it is for customers to resolve their issues. It’s typically measured with the question: “How easy was it to resolve your issue?” on a 1–7 scale (1 = very difficult, 7 = very easy).
Reducing customer effort is one of the most effective ways to improve customer satisfaction and build loyalty. Customers just want problems solved quickly and painlessly.
The customer effort score CES is one of the best customer support metrics for predicting customer retention. Low effort correlates with repeat purchases and positive word-of-mouth. High effort drives churn and negative reviews.
Calculate CES by averaging customer responses to the effort question. Track it by channel and intent to identify friction points in the customer journey.
Meeting customer expectations on effort means making every interaction feel effortless, whether customers are chatting with an AI customer service chatbot, speaking to an AI voicebot, or working with a human agent.
BlueTweak’s call center workforce management helps customers reach the proper queue immediately, reducing effort and improving overall customer satisfaction.
Average Handle Time (AHT) tracks the average duration of customer interactions, including talk time, hold time, and after-call work. It’s often broken down by channel into average resolution time.
AHT directly impacts operational costs and capacity. Lower AHT means your customer support team can handle more customer inquiries with the exact headcount. But AHT must be balanced with service quality, as rushing customers off the phone undermines customer satisfaction.
The goal isn’t to minimize AHT at all costs. It’s to reduce unnecessary time—time spent hunting for information, waiting for systems to load, or repeating steps that should be automated.
Calculate AHT by dividing total handle time (talk + hold + wrap-up) by the number of interactions. Track it by intent, channel, and agent. Compare it against the resolution rate to ensure efficiency doesn’t compromise quality.
BlueTweak tracks AHT alongside FCR and CSAT in customer service analytics to provide a comprehensive view of performance.
Containment Rate measures the percentage of customer inquiries resolved without human intervention. This is usually handled through self-service channels such as chatbots, knowledge bases, IVR systems, or help centers.
Containment is one of the most impactful customer support KPIs for cost control. Every issue resolved by automation is one less ticket for your customer service team to handle. For SaaS customer support metrics, containment directly correlates with scalability.
But containment only works if customers are satisfied with the outcome. A high containment rate paired with low customer satisfaction indicates that your self-service is deflecting rather than resolving issues.
How to Measure Containment Rate
Calculate containment by dividing the number of issues fully resolved by self-service by total customer interactions, then multiplying by 100. Break it down by intent to identify which customer queries are best suited for automation.
Metrics to evaluate AI success in customer support always include containment. If your AI voicebot or AI customer service chatbot isn’t driving measurable containment, it’s not working.
How to Improve Containment Rate
BlueTweak’s customer support automation increases containment while maintaining high satisfaction by grounding AI in your actual policies and knowledge.
Net Promoter Score (NPS) measures customer loyalty by asking: “How likely are you to recommend us to a friend or colleague?” on a 0–10 scale. Respondents are categorized as Promoters (9–10), Passives (7–8), or Detractors (0–6).
NPS predicts long-term customer retention and customer lifetime value better than almost any other metric. Loyal customers drive repeat revenue, refer new customers, and tolerate occasional service hiccups.
While NPS doesn’t measure individual interactions like CSAT, it reflects overall customer sentiment toward your brand. Low NPS indicates systemic issues in customer experience, product quality, or service delivery.
Calculate NPS by subtracting the percentage of Detractors from the percentage of Promoters. An NPS above 50 is excellent; above 70 is world-class.
Survey customers periodically (quarterly or after major milestones) to track trends. Compare NPS across customer segments, product lines, and support channels to identify areas for improvement.
BlueTweak’s customer service analytics track NPS trends alongside operational metrics, helping you connect service improvements to customer loyalty.
Customer Churn Rate tracks the percentage of customers who stop doing business with you over a given period. It’s the inverse of the customer retention rate.
Churn directly impacts revenue. Acquiring new customers costs 5–25x more than retaining existing ones, so reducing customer attrition is one of the highest-ROI activities for any business.
The churn rate reveals whether your customer service success is real or just surface-level. You can have high CSAT scores but still lose customers if underlying issues aren’t addressed.
Calculate churn by dividing the number of customers lost during a period by the total number of customers at the start of that period, then multiplying by 100.
Break down churn by cohort (acquisition month, product tier, support interaction history) to identify patterns. Customers who’ve had negative support experiences churn at higher rates than those with positive ones.
BlueTweak integrates churn risk signals into customer profiles to help teams prioritize at-risk customers and take preventive action.
Measuring these key customer support metrics is only helpful if you can act on the data. That’s where BlueTweak comes in.
| Feature | How it Works | Impacted Metrics |
| Unified Analytics | Tracks performance across all channels by intent, segment, and agent. | FCR, CSAT, CES, AHT, NPS, Churn |
| Real-Time Dashboards | Provides live visibility for managers to adjust staffing and SLAs dynamically. | AHT, SLA Risk, Queue Depth |
| Integrated QA Tools | Samples interactions and tags defects to improve training and processes. | FCR, Quality Scores, CSAT |
| AI Automation | Uses voicebots, chatbots, and suggested replies to handle routine tasks. | Containment, AHT, FCR |
| Multilingual Support | Delivers consistent service across global markets in multiple languages. | CSAT, Global Churn |
| Transparent Pricing | Clear, upfront costs to scale your support operations without surprises. | ROI, Operational Budget |
If a metric doesn’t change a decision, it’s noise. Focus on FCR, CSAT, CES, AHT, Containment, NPS, and Churn, by intent, channel, and segment, and assign a clear owner and playbook to each. That’s how you translate customer service data into faster resolutions, lower costs, and stronger loyalty.
Next steps for the next 30 days:
BlueTweak gives you one place to track these seven metrics in real time, see where performance breaks, and trigger actions, routing changes, knowledge updates, or automation, so every number turns into an operational win. Request a demo and see how BlueTweak helps you measure customer service metrics that improve satisfaction and operational costs.
To measure customer service metrics effectively, track the seven core metrics by intent, channel, and customer segment. Use customer service reporting dashboards that show trends over time, identify areas for improvement, and enable action. BlueTweak centralizes these metrics and lets you drill from KPIs to the underlying conversations by brand and region.
CSAT measures satisfaction with a specific interaction: how satisfied customers are with one support experience. NPS measures overall customer loyalty and the likelihood of recommending your brand. CSAT is transactional; NPS is relational. BlueTweak tracks CSAT and NPS side by side and ties feedback to intents, channels, and agents so you can see what’s driving each score.
Improve FCR by grounding answers in a unified knowledge base, equipping agents with suggested replies and canned responses, using AI ticket summaries for instant context, and empowering agents to resolve issues without unnecessary escalations. The contact resolution rate measures how often customers have issues resolved on the first contact, so focus on giving your team the tools and authority to close tickets immediately. BlueTweak provides the KB, copilot suggestions, and approval workflows to lift FCR without risking policy violations.
Metrics to evaluate AI success include Containment Rate (the percentage of cases resolved without human intervention), CSAT for AI interactions, and reduction in Average Handle Time. Also track Customer Effort Score for AI-handled interactions to ensure automation reduces friction. Compare these KPIs before and after AI implementation to measure real impact. BlueTweak reports these metrics out of the box and highlights pre- and post-deltas by intent and channel.
As Head of Digital Transformation, Radu looks over multiple departments across the company, providing visibility over what happens in product, and what are the needs of customers. With more than 8 years in the Technology era, and part of BlueTweak since the beginning, Radu shifted from a developer (addressing end-customer needs) to a more business oriented role, to have an influence and touch base with people who use the actual technology.