Analytics & reporting that turns support data into action
BlueTweak gives agents, managers, and executives real-time visibility across every channel: live dashboards, performance trends, and operational insights tied to actual interactions.
Trusted by leaders of CX
Challenge
Why analytics and reporting break
Without a unified view, analytics and reporting turn into busywork instead of guidance. If you can’t see performance clearly, you can’t improve it consistently.
Siloed workflows make custom reports brittle and hard to maintain.
Hidden early signals mean leaders see issues only after SLAs slip or quality drops.
Spreadsheet wrangling eats time that should go to improving operations.
Scattered data obscures true performance across channels and teams.
Why BlueTweak?
The analytics and reporting layer that turns fragmented support data into a single, actionable view.
Updates in real time
Links insights to actual interactions
Adapts to every role and team
Ensures data governance and security
The BlueTweak approach
Analytics and reporting built on interactions.
Real context, not disconnected channel metrics.
BlueTweak treats every conversation as an interaction and builds reporting and analytics on top, so dashboards mirror real operations across email, chat, voice, and social.
Agents gain real-time visibility to act early on bottlenecks, with dashboards for every role (agents self-correct, managers spot trends, executives align to KPIs) and a single source of operational truth without stitching tools.
Analytics and Reporting, Optimized.
Protect SLAs with earlier signals
Spot volume shifts and queue pressure sooner, and act before customers feel it.
Improve team performance
Give agents clear KPI views so they can adjust in real time.
Turn trends into targeted improvements
Find recurring issues by channel, topic, or team, and focus coaching and process fixes where they matter.
Reduce reporting complexity
Spend less time maintaining dashboards and more time improving outcomes.
What powers analytics & reporting?
Real-time dashboards
Give agents personal KPI views to self-correct quickly, while managers spot queue pressure, bottlenecks, and early quality dips.
Operational overview by channel
Track volume, outcomes, and trends across email, chat, voice, and social in one place.
Reporting for reviews & accountability
Support weekly and monthly reviews with clear KPI reporting on productivity and performance.
WFM-connected analytics
Tie workforce dashboards and KPI reporting into the same analytics layer for a single operational picture.
Built to connect quality, staffing, and feedback
For support and CX leaders, ops teams running reviews, and organizations consolidating tools into one source of truth.
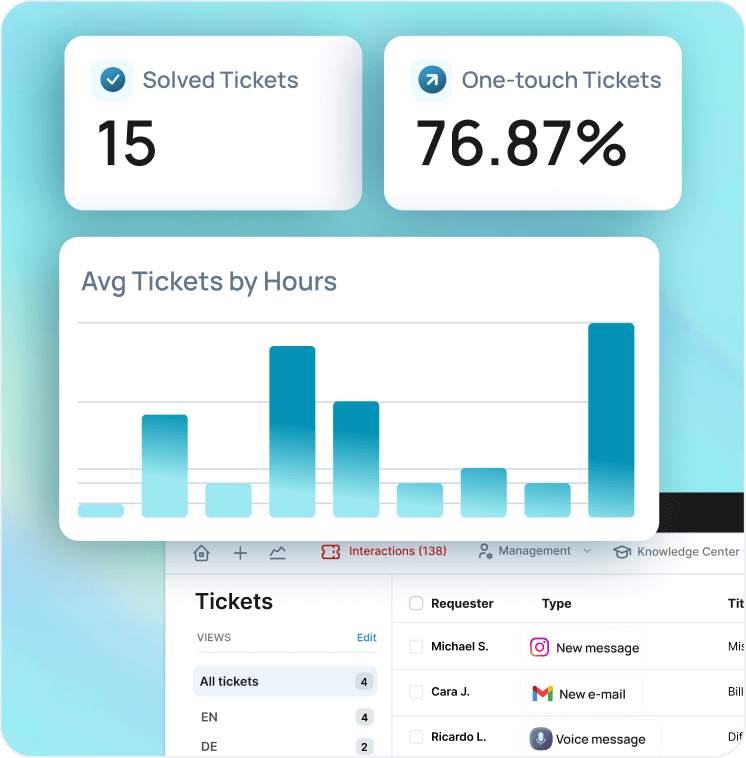
Analytics links QA, WFM, and surveys so insights turn into measurable improvements over time.
See live cross-channel dashboards that surface bottlenecks early and translate insights into better quality and performance.
FAQ
How does BlueTweak differ from standard help desk analytics and reporting?
Most platforms offer siloed, channel-specific metrics that are hard to stitch together. BlueTweak provides a unified interaction layer, meaning we treat every conversation across email, chat, voice, and social as a single source of truth. You get a holistic view of performance without the "spreadsheet wrangling."
Can agents see their own performance, or is this just for managers?
BlueTweak is built for every role. We provide real-time agent dashboards that allow team members to see their own KPIs and self-correct bottlenecks before they impact SLAs. This transparency reduces the "black box" feel of performance reviews and empowers agents to own their growth.
Will this help us catch spikes in volume before they become a crisis?
Absolutely. Our analytics are designed for early risk detection. By surfacing real-time queue pressure and volume shifts as they happen, managers can reallocate resources or adjust workflows immediately, rather than discovering the issue during a post-mortem next week.
How does reporting integrate with our Quality Assurance (QA) data?
BlueTweak closes the loop by linking insights to actual interactions. You can see exactly how QA scores correlate with AHT, CSAT, and productivity. This allows you to move beyond "what happened" and see "why it happened," turning high-level trends into targeted coaching or process fixes.
See analytics and reporting in action
Go to Top