Customer Support Automation ROI: How to Measure What Matters

BlueTweak is an AI Customer Support Platform that unifies every conversation, customer record, and automation into one workspace.
Explore more
Insights, trends, and practical ideas from customer experience and AI
Real-world scenarios showing how teams use BlueTweak to deliver better service
The daily blueprint that guides customer support leadership.
ROI and savings calculators for support teams
See how BlueTweak stacks up against leading customer support platforms
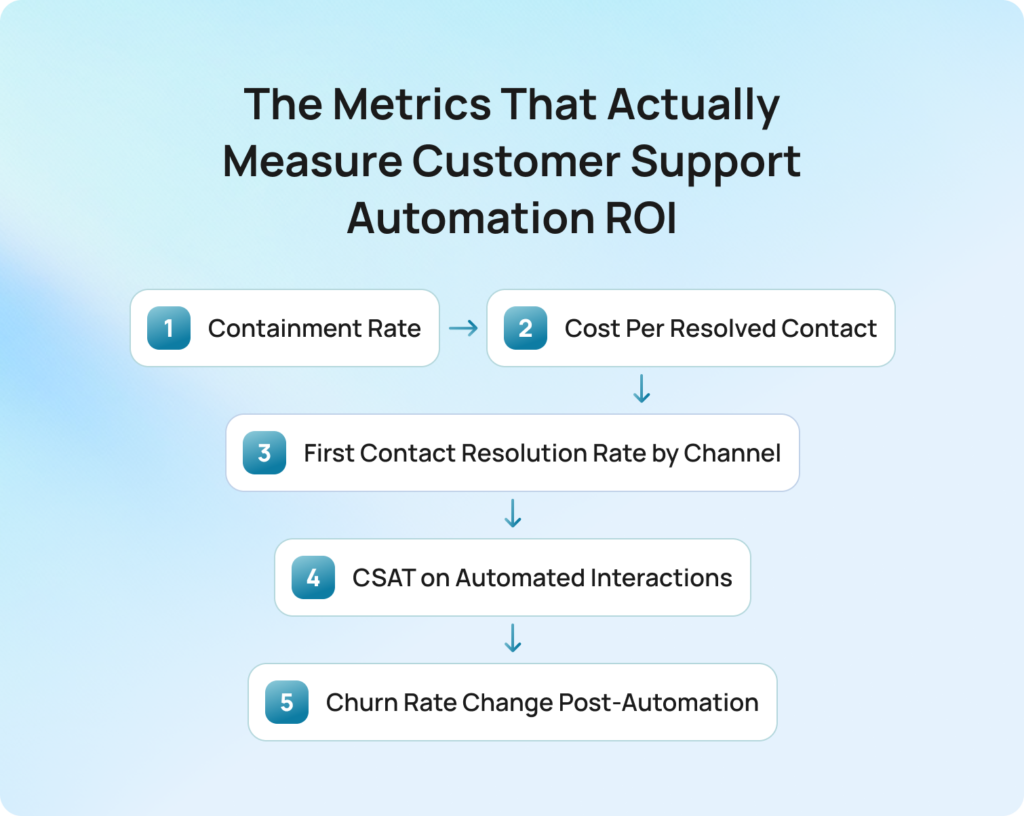
Customer support automation ROI is almost always overstated at the point of sale and undermeasured after deployment. The three measurement errors most teams make are: counting deflection instead of containment, dividing total cost by tickets closed instead of issues resolved, and reporting headcount savings before they have actually materialised. The three metrics that actually matter are containment rate, cost per resolved contact, and churn rate change segmented by interaction type. Get those three right, and you have a measurable ROI you can defend to leadership. This article also covers how to track ROI on AI customer support automation across the 30, 90, and 180-day horizons that operations teams actually report against.
Let’s start with the honest version of this conversation, because in 2026, most customer service operations teams are working with customer service ROI projections that will not survive contact with reality. Measuring customer service ROI accurately is harder than vendors make it look, and the gap between what gets promised and what gets delivered is almost always a measurement problem, not a performance problem.
That is not a technology problem. Automation genuinely delivers a significant return when it is deployed well and measured correctly. The problem is the measurement methodology, which inflates early results, hides long-term performance problems, and sets teams up to explain why the numbers looked better in the proposal than they do six months in.
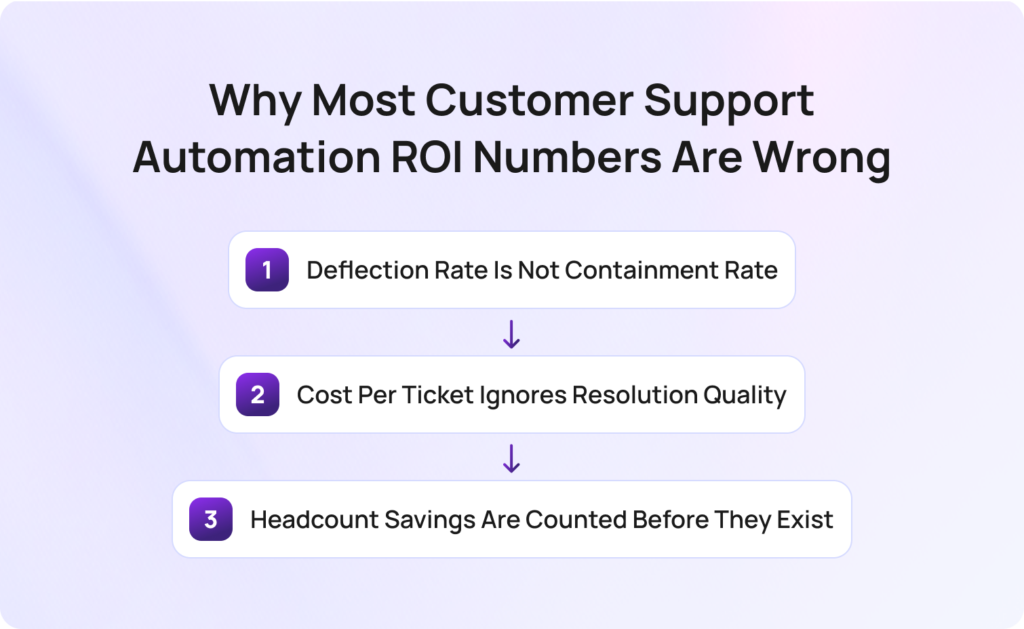
Three measurement errors account for most of it.
This is the single most common and most consequential measurement error in support automation. Deflection rate counts the number of sessions that ended inside the bot without escalating to a human agent. Containment rate counts the number of contacts that reached a full resolution without the customer following up on any channel within 24 hours.
A customer who used the bot, got an incomplete answer, and then sent an email is counted as deflected. They are not contained. They generated two contacts instead of one. Most customer service AI and AI customer service automation vendor dashboards report deflection by default, because deflection is the metric that makes customer interactions look resolved faster than they are.
Dividing the total support operating cost by the total tickets closed produces a number that falls when automation closes more tickets, even when automation is creating repeat contacts by failing to resolve the underlying issue. A team with a bot generating failed self-service attempts will show a lower cost per ticket and declining customer satisfaction scores simultaneously. Improved customer satisfaction and service quality are moving in opposite directions from the cost metric, while the cost metric flatters the deployment. The metric looks good. The operation is getting worse.
Reducing average handle time by 20% does not automatically reduce headcount by 20%. It creates capacity. Real headcount ROI requires either a hiring freeze applied against projected growth or an actual reduction in force. Both are real outcomes, but they take time and deliberate management decisions to materialise. Most ROI projections count them on day one.
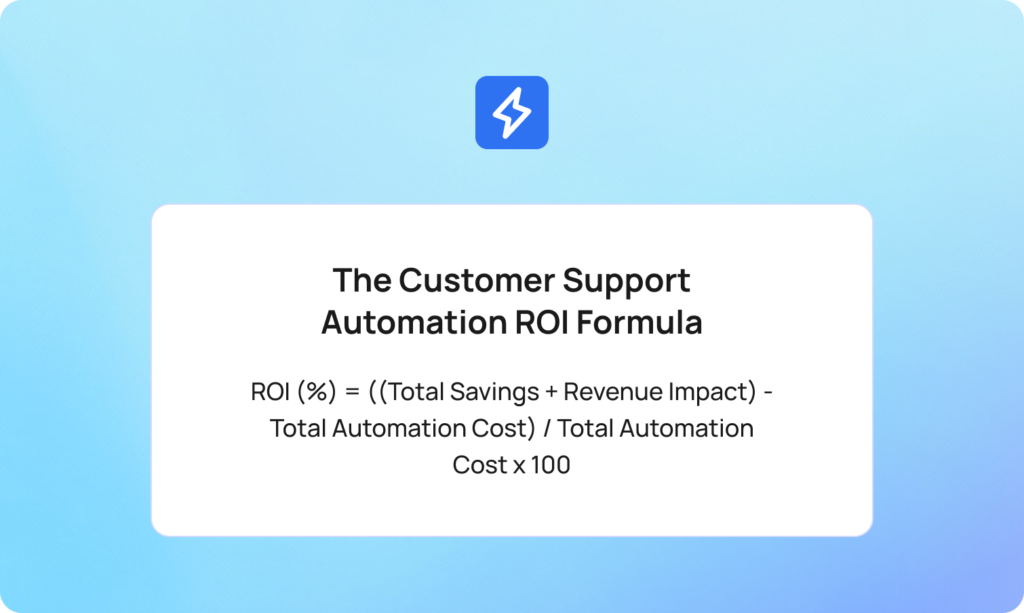
The formula itself is straightforward. The discipline is in what you put into it.
ROI (%) = ((Total Savings + Revenue Impact) – Total Automation Cost) / Total Automation Cost x 100
Each component deserves a precise definition.
The reduction in cost per resolved contact, multiplied by resolved contact volume. Not deflection volume. Not ticket closure volume. Resolved contact volume: the number of contacts that reached a full resolution in the measurement period. If your cost per resolved contact falls from €8 to €3 on automated interactions, and you handle 15,000 automated resolutions per month, your monthly saving is €75,000.
The improvement in customer retention is attributable to service quality, quantified through churn rate reduction. Keeping existing customers costs less than acquiring new ones. Customer expectations of fast, accurate service are rising, and automation that meets those expectations compounds value through customer loyalty, higher lifetime value, and revenue growth over time. A 1% reduction in monthly churn on a customer base with an average lifetime value of €500 is a concrete number. Most ROI models leave this cell empty or fill it with aspirational estimates. It is the hardest component to measure and the most important to get right, because it is where automation either creates or destroys long-term value.
Platform licensing, implementation fees, ongoing KB maintenance, model retraining, escalation overhead, and internal resource time for managing the system. Most teams calculate the first two correctly and ignore the rest. The cost savings and cost reduction numbers that appear in vendor proposals are built on the first two. The operational costs that determine whether lowering operational costs at scale is genuinely achievable are the ones that come after. The hidden costs of inefficient customer support systems are well documented, and the same logic applies to automation: the costs that do not appear in the vendor proposal are the ones that erode ROI silently.
A team handling 50,000 contacts per month at €8 cost per resolution deploys automation scoped to tier-1 queries. At 90 days, the containment rate on automated interactions is 62%. That means 31,000 contacts are fully resolved by automation at €2.50 cost per resolution, and 19,000 are handled by human agents at €8. Monthly saving: (31,000 x €5.50) = €170,500. Monthly platform cost, including maintenance: €18,000. Monthly net saving: €152,500.
That is a real number from a realistic deployment, and it only holds if the containment rate is measured correctly.
For an overview of customer support automation ROI calculator tools comparison, the BlueTweak ROI calculator is one of the few built specifically for contact centers running AI automation. It accepts your actual cost per resolution, contact volume, and containment targets and outputs a time-phased projection rather than a single headline number.
Containment rate is the percentage of automated interactions that reach a complete resolution without a follow-up contact on any channel within 24 hours.
Calculation: (Fully resolved automated contacts / Total automated contacts attempted) x 100
The 24-hour cross-channel window is what makes this metric honest. A customer who ended a bot session and sent an email 90 minutes later was not contained. Measuring containment properly requires joining bot session data with email, chat, voice, and social contact data. That is why teams using fragmented tooling default to deflection rate. It is not a better metric. It is an easier one.
For a well-scoped tier-1 deployment at 90 days, a containment rate of 55–70% is a realistic target. Automating routine tasks and routine inquiries, password resets, billing inquiries, order status, and account updates is where self-service capabilities deliver the most consistent results. Below 50% usually signals either a scope problem (the bot is handling interactions it cannot resolve) or a knowledge base problem (the content it is grounding responses in is incomplete). Expanding self-service options before fixing a knowledge base gap will not improve containment.
Total support operating cost divided by the number of contacts that were resolved, not closure, in the measurement period.
The distinction between closure and resolution matters. A ticket marked closed by an agent after a first response is not necessarily resolved. A contact where the customer sent three follow-up messages before the issue was addressed represents one resolution and three closures. Dividing cost by closures understates the true cost of poor resolution quality.
Split cost per resolved contact by channel and by interaction type (automated vs. human-handled). The gap between the two numbers is the efficiency case for automation. Watching that gap widen or narrow over time is how you track whether automation is improving or degrading.
First contact resolution rate is one of the key performance metrics that separates teams measuring automation correctly from those measuring it conveniently. It is the percentage of contacts resolved on the first interaction, tracked separately for automated and human-handled interactions. Contact resolution on the first touch is the outcome that reduces repeat contacts, lowers operational costs, and improves customer satisfaction in a single number.
Automation should increase FCR on the interactions it handles, not just reduce overall volume. If FCR on automated interactions is falling while overall contact volume is falling, the automation is resolving fewer issues per attempt. That means it is creating repeat contacts that are being absorbed elsewhere and not appearing in the automation metrics.
A misclassified contact is a misrouted contact, and a misrouted contact almost never resolves on the first touch. AI ticket classification is where that chain starts.
CSAT scored specifically on bot-handled and automated interactions, tracked separately from human-handled interactions, and reported on the same cadence.
Automation that reduces cost while reducing CSAT is destroying customer lifetime value faster than it is saving on cost per ticket. The ROI model must net the two against each other. Higher customer satisfaction on automated interactions is not just a CX metric: it is the leading indicator for containment rate, customer loyalty, and net promoter score. A 1% drop in monthly CSAT on automated interactions is an early signal that containment rate is about to fall. Customer sentiment is shifting before the operational data catches up. Tracking it separately is the fastest way to improve customer service ROI before the churn data arrives.
Structuring customer service analytics to separate automated from human-handled CSAT is what makes the comparison meaningful rather than misleading.
Change in customer churn rate at 90 and 180 days after automation deployment, segmented by customers who interacted primarily with automation versus human agents.
This is the metric most teams skip because it is the hardest to attribute. It is also the metric that captures whether automation is building or eroding the customer relationship over time. A team that reduces cost per resolved contact by 40% while increasing churn by 2% in its automated customer segment is not generating positive ROI. It is transferring cost from the support budget to the revenue line.
Most ROI models present a single number. Operations teams report to leadership in time horizons. These are not the same thing, and the mismatch is where most automation deployments lose credibility internally.
At 30 days, the model is still being calibrated. Containment rates are lower than they will be at steady state. CSAT on automated interactions often dips before it recovers as the system learns which queries it can handle confidently. Handle time may temporarily increase as agents learn the escalation workflow.
The key metrics to track at 30 days are the containment rate improving week on week, whether the escalation rate to human agents is within the expected range, and what percentage of queries the bot is unable to answer. Also track agent productivity on escalated interactions, if the AI tools are passing poor context on handoff, agents are spending more time re-reading transcripts than resolving issues. Review customer data completeness in the handoff payload. These are trajectory metrics, not ROI metrics.
Do not report headcount ROI at 30 days. Do not report a cost saving based on deflection rate. Report trajectory.
By 90 days, the containment rate should be approaching steady state for the scoped interaction types. Cost per resolved contact on automated interactions should be trackable against the pre-deployment baseline. FCR on automated interactions should be measurable and comparable to human-handled FCR on the same query types.
This is the first point at which a credible ROI number can be presented to leadership. For a well-scoped tier-1 deployment, a realistic 90-day benchmark is a 55–70% containment rate and a 30–40% reduction in cost per resolved contact on automated interaction types. This is also where AI for customer service starts delivering measurable value rather than trajectory signals. An AI-powered customer service that is showing efficiency gains at 90 days is a deployment that was scoped and measured correctly. Below those ranges, the deployment is either underscoped or the knowledge base needs attention before expanding automation coverage.
At 180 days, churn rate data becomes meaningful and attributable. Customer lifetime value impact is traceable through the retention data. Teams with predictive analytics in place can begin forecasting which customer segments are churn risks based on their automated interaction history, turning support data into a proactive customer experience input rather than a reactive report. The feedback loop between QA scoring and model improvement should be visible in containment rate improvements. A system built for continuous improvement will show steady containment rate gains between 90 and 180 days rather than a plateau, and support costs will continue to fall as the model gets better.
This is also the point at which headcount ROI can be credibly reported. The capacity freed by automation has had time to either reduce overtime costs, offset planned hiring, or support volume growth without additional headcount. Any of those outcomes is real ROI. None of them appears reliably in a 30-day measurement window.
Most vendor ROI models undercount costs. These four items appear consistently in post-deployment reviews and rarely in pre-deployment projections. Each one represents a customer service team resource, part of the ongoing customer service efforts, or a pattern in customer conversations that the initial proposal treated as zero-cost.
The automation is only as accurate as the content it is grounded in. A RAG-grounded system retrieving from an incomplete or outdated knowledge base will produce inaccurate responses, reduce containment rate, and generate the kind of failed self-service contacts that inflate repeat contact volume. KB maintenance is not optional overhead. It is a direct driver of containment rate, which makes it a direct driver of ROI.
The BlueTweak Smart Knowledge Base is built on the assumption that KB quality and automation performance are the same problem.
Intent models degrade as product changes, policy updates, and seasonal shifts alter the distribution of incoming queries. Retraining cycles, new intent category creation, and confidence threshold recalibration all require internal resource time or vendor fees. A model running on six-month-old training data against current traffic is not performing at its 90-day benchmark. Most initial ROI projections do not include a line item for ongoing optimisation.
When automation escalates to a human agent, the handoff quality determines whether the escalation adds or removes cost. A clean handoff, with full context, interaction summary, and intent classification passed to the agent, takes seconds. A poor handoff, where the agent re-reads an incomplete transcript and asks the customer to repeat their issue, adds minutes of handle time to every escalation. At scale, that is a material cost.
AI agents and conversational AI systems that pass full context across communication channels on escalation remove the need for human intervention to re-establish what the customer already explained. Human-in-the-loop AI done well is an efficiency gain. Done poorly, it offsets automation savings.
Customers who attempt self-service and fail do not disappear from the contact queue. They call, email, or message, and they arrive more frustrated than if they had contacted a human agent directly. Customer feedback on failed self-service interactions is a direct signal about customer preferences for resolution paths. Customers who prefer self-service but cannot get a resolution through it represent a containment problem and a satisfaction problem simultaneously. Failed self-service generates harder-to-handle customer inquiries with lower first-touch resolution rates and worse CSAT outcomes than contacts that never went near the bot. This volume must appear in the ROI model as a cost, not as evidence that automation is working.
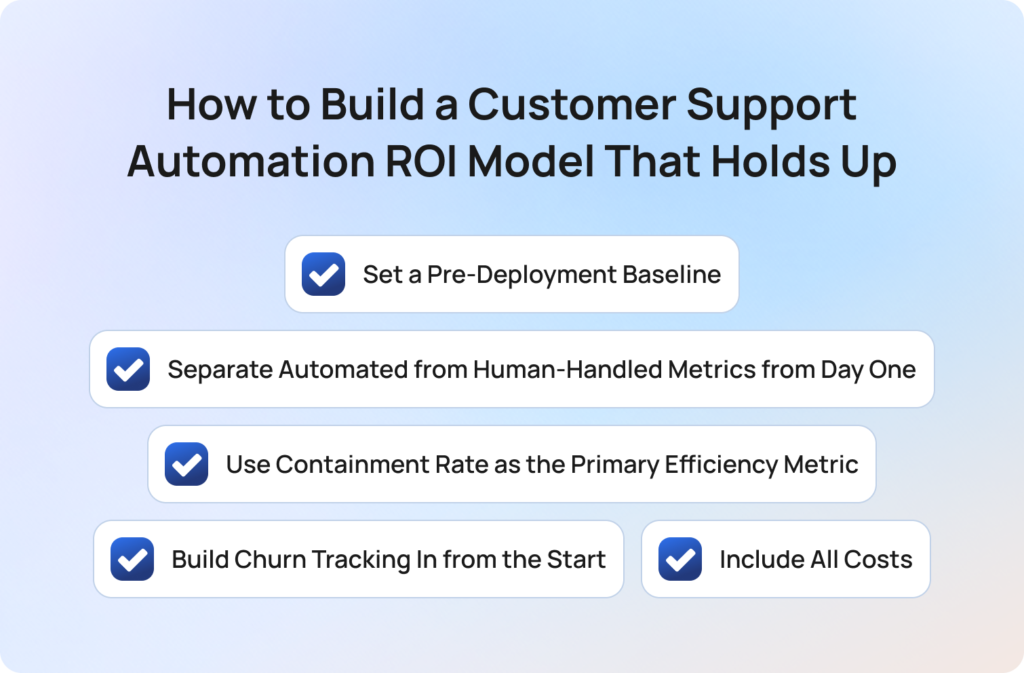
A ROI model that holds up under leadership scrutiny is built on five disciplines, not one formula. Customer service initiatives that reduce support costs and improve operational efficiency generate real returns. The measurement model is what determines whether customer support operations can prove it. Most AI implementation projects fail the ROI test, not because the technology underperformed but because the measurement model was not ready when the deployment went live.
Capture cost per resolved contact, FCR by channel, CSAT, and churn rate before automation goes live. Without a pre-deployment baseline, there is no ROI. There is only a before-and-after story that cannot be attributed to automation with any confidence.
Blended metrics hide automation performance behind human-handled performance. Set up reporting that tracks containment rate, CSAT, FCR, and cost per resolved contact separately for automated and human-handled interactions before the first automated contact is handled.
Define it precisely: resolution without follow-up contact across all channels within 24 hours. Report it weekly for the first 90 days. Any team using deflection rate as its primary automation efficiency metric is reporting a number that flatters the deployment and hides failure modes.
Segment customers by their primary interaction type and track churn separately from the first month of deployment. This is the only way to capture the revenue side of the ROI equation with any precision. AI-driven automation that maintains service quality for existing customers will show this in churn data. AI-driven automation that is degrading customer relationships will also show it there, before it shows up anywhere else. Teams that skip this step cannot answer the question that matters most: Is automation improving or degrading customer relationships over time?
Platform licensing, implementation, KB maintenance, model retraining, escalation overhead, and internal management time. If the vendor ROI model does not include KB maintenance and retraining, add them. They are not edge cases. They are the costs that determine whether 90-day performance holds at 180 days.
The BlueTweak ROI calculator is built on this framework. It accepts actual cost inputs, containment targets, and CSAT baselines and outputs a time-phased projection at 30, 90, and 180 days. A single headline number is not a measurement model. It is a marketing claim.
Most of the ROI measurement problems described above share a root cause: the platform being used to run customer service automation is not the same platform being used to measure it. Data lives in separate systems. Containment rate cannot be calculated because bot session data and email contact data are in different tools. CSAT on automated interactions is blended with human-handled CSAT because the reporting layer does not distinguish between them. The result is that AI customer support generates real service efficiency gains that the measurement model cannot capture as measurable ROI.
BlueTweak is designed so that measurement and automation run in the same workspace. AI-driven tools that generate data in one system and report it in another will always produce ROI numbers that operations teams cannot fully stand behind.
The platform tracks whether a contact recurs across channels within 24 hours, giving teams a containment rate they can report with confidence, not a deflection rate that counts sessions rather than resolutions.
The analytics and reporting layer separates automated and human-handled interaction costs, and reports cost per resolution rather than cost per ticket closure. The number that appears in the dashboard is the number that will hold up in a leadership meeting.
CSAT is tracked and reported separately for automated and human-handled interactions, so teams can see within the same view whether automation is improving or degrading satisfaction alongside cost. A rising containment rate paired with falling CSAT is a signal that the system surfaces before it compounds.
The Smart Knowledge Base and QA module work in the same system. QA flags on bot responses surface KB gaps that, once closed, directly improve containment rate. The relationship between content quality and automation ROI is visible rather than assumed.
Rather than a single ROI snapshot, BlueTweak’s reporting gives teams the trajectory view they need to report credibly at each stage of deployment: week-on-week containment improvement, 90-day FCR comparison, and 180-day churn segmentation, all in the same platform.
The teams that struggle to prove automation ROI are almost never struggling because the automation is not working. They are struggling because the measurement model they are using was built to show deflection, not resolution. Once you switch to measuring containment, cost per resolved contact, and churn by interaction type, the ROI story becomes a lot clearer and a lot more defensible. The question changes from ‘did the bot handle the contact?’ to ‘did the customer’s problem get solved?’ Those are very different questions, and they produce very different numbers.

Radu Dumitrescu, Head of Presale and Digital Transformation at BlueTweak
Customer support automation ROI is real. The business outcomes it delivers, reducing costs across tier-1 interactions, better customer experience, and stronger customer retention, are significant for any customer service team running at scale. The teams generating measurable ROI are not doing anything exotic. They are measuring containment instead of deflection, tracking cost per resolved contact instead of cost per ticket, building churn segmentation into their model from the start, and including the hidden costs that most vendor proposals omit.
The teams that cannot show ROI at 180 days are usually the ones that reported a deflection rate at 30 days, called it success, and stopped measuring. The number looked good. The operation did not improve.
Get the measurement model right first. The ROI follows from the discipline, not the technology.
Run your own numbers with the BlueTweak ROI calculator and see what a realistic 90-day and 180-day projection looks like for your team. Or start your free trial and build the measurement infrastructure alongside the automation from day one.
A well-scoped tier-1 automation deployment at 90 days should show a containment rate of 55–70% and a 30–40% reduction in cost per resolved contact on automated interaction types. As a percentage return, that typically translates to a positive ROI within the first 90 days when costs are counted correctly. The number varies significantly by contact volume, current cost per resolution, and knowledge base quality.
Deflection rate counts bot sessions that ended without escalating to a human agent. Containment rate counts contacts that reached a full resolution without the customer following up on any channel within 24 hours. A customer who used the bot and then sent a follow-up email is deflected but not contained. They generated two contacts. Containment rate reflects whether automation is actually resolving issues. Deflection rate reflects whether customers stopped trying within the bot session. They are not the same, and most vendor dashboards report deflection by default.
Early signals are visible at 30 days: containment rate trajectory, escalation rate, and knowledge base gap rate. The first credible ROI number arrives at 90 days when the containment rate is approaching steady state, and the cost per resolved contact is trackable against the baseline. The full picture, including churn rate impact and customer lifetime value change, requires 180 days.
Four costs appear consistently in post-deployment reviews and rarely in pre-deployment proposals: knowledge base maintenance, model retraining and optimisation, escalation handling overhead, and failed self-service follow-up volume. All four belong in the cost side of the ROI formula. Content that is not kept current directly reduces the containment rate. Poor escalation design adds handle time to every transfer. Failed self-service generates repeat contacts that are harder to resolve than first-contact queries.
Segment customers by their primary interaction type, primarily automated versus primarily human-handled, from the first month of deployment. Track churn rate separately for each segment at 90 and 180 days post-deployment. The difference between the two churn rates, net of pre-deployment baseline churn, is the retention impact attributable to automation quality. If the automated segment shows higher churn, the automation is damaging the customer relationship faster than it is reducing cost per ticket.
As Head of Digital Transformation, Radu looks over multiple departments across the company, providing visibility over what happens in product, and what are the needs of customers. With more than 8 years in the Technology era, and part of BlueTweak since the beginning, Radu shifted from a developer (addressing end-customer needs) to a more business oriented role, to have an influence and touch base with people who use the actual technology.