
12 Customer Service Analytics Tips to Improve SLAs and FCR

BlueHub unifies every conversation, customer record, and automation into one powerful platform.
Explore more
Customer service analytics transform interaction data into informed staffing, process, and content decisions that enhance Service Level Agreements (SLAs) and First Contact Resolution (FCR) rates. Most teams stall because their data is scattered across various tools, tags are inconsistent, and insights never reach the people who schedule agents or update knowledge articles. This guide shows you how to unify ticket-level data with customer analytics, track the key metrics, and close the loop weekly with targeted fixes.
Customer service data holds the answers to why queues miss SLAs, why specific issues need three touches instead of one, and why German-speaking customers wait twice as long as English speakers. The problem is not a lack of data. Analytics often reside in five different places, and tagging for terms like “billing issue” is not standardized. Additionally, monthly reports rarely impact Tuesday staffing or guide knowledge base rewrites.
Support leaders running 20 to 100 agent teams face a specific challenge: the operation is big enough that gut feel does not scale, yet small enough that a whole analytics team is out of reach. What is needed are actionable insights that drive fundamental changes to schedules, macros, workflows, and content.
This guide outlines practical steps to turn customer support analytics into better outcomes. It covers how to unify data, which metrics actually predict performance, and how to build a weekly rhythm that connects insights to action.

Customer service analytics means transforming interaction data (tickets, calls, chats, emails) into informed decisions about staffing, processes, and content that directly improve SLA adherence and First Contact Resolution.
This might involve identifying which queues will miss targets by Tuesday afternoon, which intents consistently fail on the first touch, and which languages exhibit worse performance. Then, it’s about adjusting agent schedules, updating canned responses, fixing handoff rules, and rewriting knowledge base articles based on what the data tells you.
Good customer service analytics close the loop from measurement to action within days. Most teams waste their analytics efforts in three ways:
Between 2015 and 2026, customer service analytics transitioned from end-of-month Excel exports to unified, real-time dashboards with intent taxonomies, role-based views, and predictive forecasting, all tied directly to staffing and coaching decisions. The old model meant pulling ticket exports at month-end, manually tagging conversations in spreadsheets, building pivot tables, and emailing static reports that led to quarterly discussions and maybe some changes that were never verified.
Modern customer service analytics software unifies data at the ticket level, applies consistent tagging through automation, displays live SLA and FCR metrics, and integrates directly with workforce management and quality assurance systems. Three forces pushed this evolution:
When evaluating analytics capabilities, prioritize unified ticket-level data across channels, a stable intent taxonomy you can maintain, live SLA and FCR dashboards, and closed-loop workflows. You want to connect insights to staffing changes, process improvements, and updates to the knowledge base.
Effective customer service analytics involve unified data, where every ticket is assigned consistent tags for intent, channel, brand, and language. A stable taxonomy of 30-50 intents that covers 80% of volume without constant redefinition. Weekly reviews where a human interprets the numbers and assigns clear actions:
It should lead to visible changes to schedules, macros, handoff rules, and knowledge content based on what last week’s data revealed.
Good doesn’t require machine learning models, data lakes, or a team of analysts. It requires discipline in tagging, reviewing frequency, and accountability for taking action.
Ultimately, it’s about looking beyond the metrics and understanding what they truly mean. They’re numbers on a dashboard, but they help retain customers, foster customer loyalty, improve customer trust, gauge customer sentiment, enhance customer satisfaction, and inform data-driven decision-making.

These tips begin by unifying data at the ticket level and making performance visible in real-time, so SLA and FCR issues surface by intent, channel, language, and queue. They then show how to act on those signals with AI summaries, targeted knowledge fixes, transfer-reason instrumentation, calibrated QA, WFM forecasting, language and region splits, transcript mining, role-based dashboards, and a weekly measure → change → re-measure loop.
Scattered data kills analytics. When voice calls reside in one system, email tickets in another, and chat logs in a third, you can’t view complete customer journeys or accurately compare channel performance.
Start by centralizing all interactions in a single ticketing system, where every customer conversation is assigned a ticket with standard fields: customer ID, intent, channel, brand, language, assigned agent, timestamps, resolution status, customer lifetime value, and transfer history.
Standardize your tagging taxonomy with 30-50 intents that cover your most common scenarios. Create mandatory dropdown fields for brand and language. Create routing rules that automatically apply these tags based on keywords and context.
Without unified, tagged data, every downstream metric is suspect.
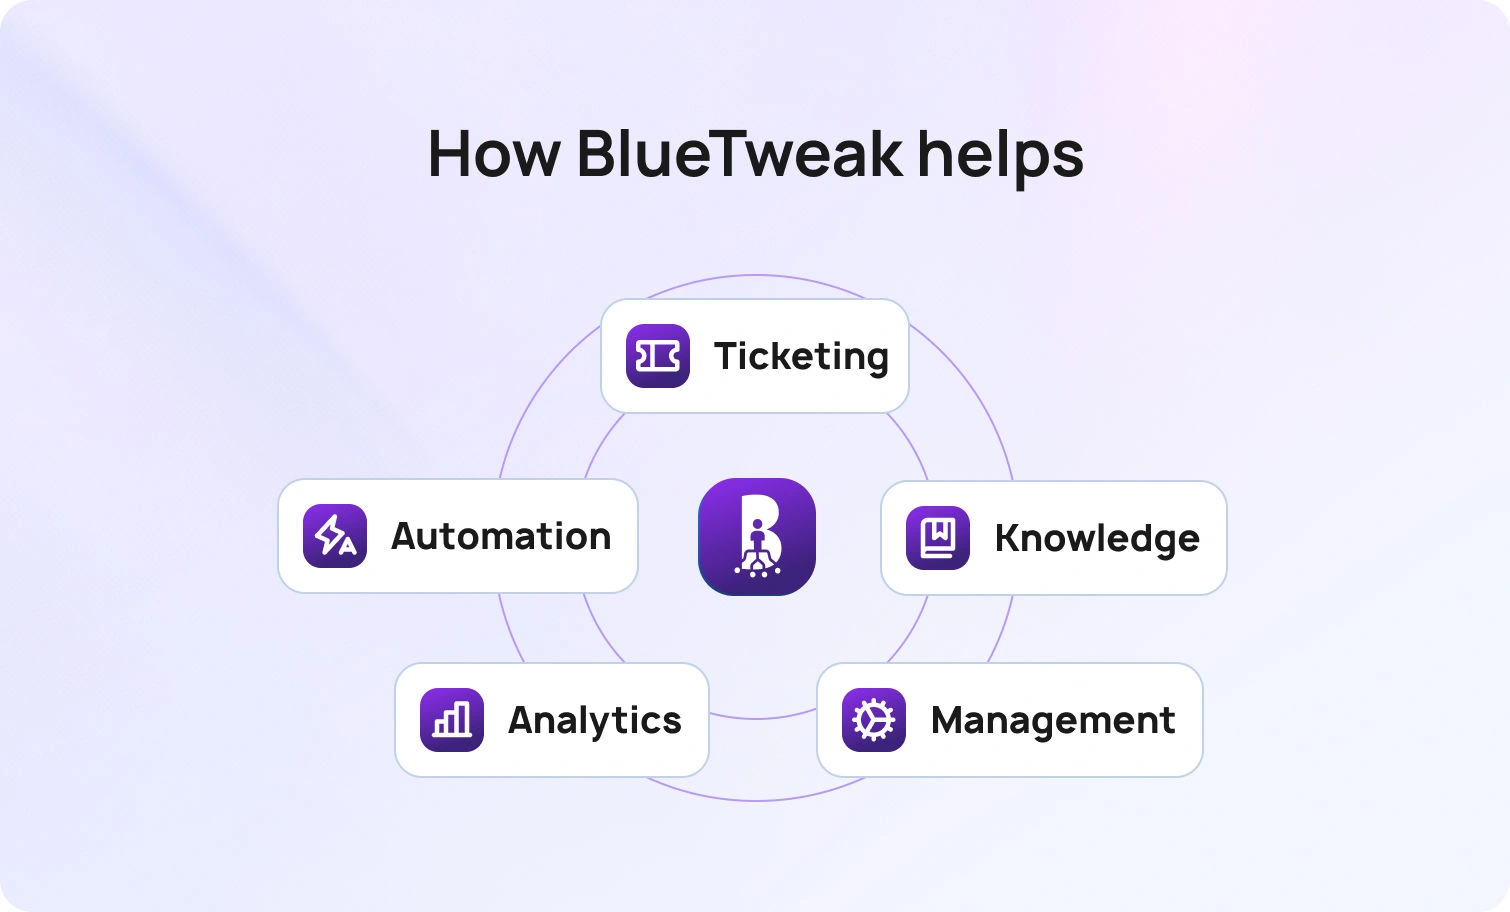
BlueTweak centralizes omnichannel interactions in unified ticketing with automatic classification, tagging, and routing based on intent detection. This gives you a single-source truth for all analytics.
Monthly reports on SLA performance arrive too late to fix the problem. Build live dashboards that show current service levels by queue, updated every 5-10 minutes:
Make these visible to operations managers and team leads throughout the day with alert thresholds that trigger notifications when any queue drops below 80%.
Live visibility creates accountability and enables fast response. When you can see a queue trending toward a breach at 2 pm, you can pull agents from lower-priority channels or adjust break schedules to prevent the damage from occurring.
BlueTweak’s real-time dashboards track SLA adherence by queue, priority, and channel with configurable alerts when thresholds are breached. It turns SLA monitoring from a monthly postmortem into daily operations management.
Overall, First Contact Resolution (FCR) provides limited actionable insight at the aggregate level. However, breaking it down by intent and channel shows you exactly which scenarios fail and why.
Build reports that calculate FCR for each intent in your taxonomy and segment by channel. For example, email billing questions may achieve an 80% FCR, while chat billing questions drop to 40%.
Set a target where anything below 65% FCR deserves investigation. For each low-FCR intent, ask:
Then fix the root cause and re-measure after two weeks to confirm improvement.
BlueTweak’s custom reporting segments FCR by intent, channel, brand, and language, allowing for precise identification of scenarios that require attention.

Agents waste 90 seconds per ticket reading through conversation history to understand context before responding. AI Ticket Summaries extracts key details (customer issue, previous interactions, current status, attempted solutions) into a 3-4 sentence overview at the top of every ticket. Agents grasp the situation in 10 seconds and immediately jump to a resolution.
Shorter triage time means faster first responses. When agents handle inquiries 60-90 seconds faster, your first response time decreases by 15-20%, improving SLA attainment and creating the capacity to handle higher volumes without hiring additional staff.
BlueTweak generates AI summaries automatically for email, chat, and voice interactions, displaying them prominently in the agent workspace to accelerate triage and handoffs.
Low FCR by intent typically indicates a lack of or inadequate knowledge content. Implement a weekly knowledge review process: pull the bottom 10 intents by FCR, verify each has a current article, and update or create content where gaps exist.
Make articles actionable with clear steps, decision trees, common edge cases, and exact language agents can use in responses.
Align your knowledge base with canned responses and suggested reply features, allowing agents to pull accurate, approved language directly into tickets. After updates, re-measure FCR for that intent. If it improves by 10 percentage points or more within two weeks, the knowledge change has been effective.
BlueTweak’s integrated Knowledge Base connects directly to the agent workspace, featuring AI-powered search and Suggested Reply that automatically pulls relevant content into draft responses.
Transfers kill FCR. Every handoff drops resolution to zero. Add a mandatory “transfer reason” field to every handoff: wrong queue, need specialist approval, technical limitation, customer request, escalation.
Weekly, report on transfer volume by reason and originating queue to discover patterns.
Many transfers are avoidable:
BlueTweak supports custom transfer-reason fields, including required dropdowns where enabled.
Add FCR-focused criteria to quality reviews:
Review low-FCR intents specifically and use findings to build stronger customer relationships through targeted coaching.
Don’t tell agents to “improve the customer experience”. Show them the specific ticket where incomplete information caused a reopen, demonstrate the improved response, and track the improvement in their subsequent ten similar interactions.
BlueTweak’s Quality Assurance features support custom scoring criteria, intent-filtered reviews, and coaching workflows tied to performance metrics.

Implement basic workforce management forecasting by analyzing historical volume by day, hour, and channel over the past 90 days. Identify patterns: Monday mornings peak 40% above average, Friday afternoons drop 25%, the first week of the month spikes 50% due to billing cycles.
Build staffing schedules that match predicted demand and protect your highest-priority queues during known peak periods.
Review forecast accuracy weekly. When the actual volume deviates significantly from the prediction, update your model and investigate the cause: did a campaign drive unexpected contacts, or was a product issue responsible for a surge?
BlueTweak includes native Workforce Management with volume forecasting, optimal schedule generation, and real-time adherence tracking to align staffing with demand and protect SLAs.
Segment all metrics by language and region to catch disparities where your secondary-language(s) queue runs at 60% SLA while English hits 85%. Compare SLA attainment, FCR rates, average handle time, and customer satisfaction scores across languages and brands.
Disparities typically arise from uneven staffing, inadequate multilingual content, or routing issues. Here’s what to do about it:
BlueTweak provides multilingual AI across voice and text, including instant language switching in the voicebot, multilingual knowledge base support, and analytics segmented by language and brand to identify and close performance gaps.
Implement call transcription for voice interactions and review transcripts where customer feedback mentions “I tried the chat” or “I sent an email yesterday” to understand why the first attempt failed. Tag these escalation reasons: chat couldn’t answer, email response unclear, knowledge article outdated, or chatbot failed.
Aggregate findings weekly and fix the upstream issues. Retrain the AI chatbot with more effective examples, revise the confusing email macro, or update the outdated article. Measure whether escalation rates for that intent drop over the following two weeks.
BlueTweak’s call transcription, with options to analyze trends and escalation patterns, identifies escalation patterns and connects voice data to earlier digital interactions for root-cause analysis.
Build three role-specific views instead of one support dashboard.
Each role needs different data analytics at different frequencies. Operations need real-time visibility to react within hours. Coaches need daily trends to spot skill gaps. Executives need strategic context, not minute-by-minute noise.
BlueTweak provides pre-built dashboards tailored to typical roles, along with custom analytics and role-based views and permissions. This helps each team member see the metrics they need to act on without being overwhelmed by irrelevant data.
Establish a weekly 30-minute meeting where you review the numbers, assign specific changes, and track outcomes. Review SLA and FCR by queue, language, and intent, and flag any items that fall below target.
Identify the top 3 issues and assign owners for each fix. Confirm last week’s changes worked. Document decisions and outcomes in a shared log.
Minor, frequent improvements compound better than quarterly overhauls. Fixing three knowledge gaps per week means 150+ improvements per year. Weekly reviews create accountability, and assigned changes actually happen because everyone knows they’ll report progress next Tuesday.
BlueTweak’s analytics platform provides the data you need for these reviews, and the integrated Knowledge Base, Quality, and WFM tools let you implement and verify changes without leaving the platform.
The practical path for most 20-100 agent teams starts with workforce management forecasting to predict next week’s volume and staff accordingly. If historical data shows product-launch weeks drive 60% more “how-to” tickets, you can predict the spike (and future outcomes), pre-staff appropriately, and create knowledge articles in advance.
Advanced predictive models (identifying high-risk customers likely to churn, predicting which existing high-value customers will upgrade, forecasting individual ticket resolution times) typically require exporting customer service data to business intelligence platforms where you can join it with CRM, billing, and product usage data.
Ultimately, predictive analytics are all about informing proactive measures. You want to understand customer needs, customer expectations, and what they need for improved customer satisfaction.
BlueTweak’s supports both paths: native WFM forecasting for staffing, plus integrations to external BI tools for advanced predictive models.
https://bluetweak.com/wp-content/uploads/2025/10/Implementation-roadmap.webp
First 30 Days: Finalize intent taxonomy, enable live SLA dashboards, baseline current FCR overall and by top 10 intents, fix top 10 article gaps, implement mandatory transfer-reason tracking.
Days 31-60: Build role-based dashboards, calibrate quality reviews to include FCR criteria, pilot AI Ticket Summaries with one team, create a weekly analytics review meeting with an action log, and add language/region segmentation to all reports.
Days 61-90: Integrate Workforce Management forecasting into staffing process, expand Knowledge Base coverage to all intents below 65% FCR, implement call transcription and escalation mining, document “measure → change → re-measure” playbook, establish quarterly analytics review for strategic initiatives.
Measure what matters:
BlueTweak tracks all these metrics in real-time dashboards with custom reporting, filtering by any ticket attribute, and exportable data for deeper analysis.
Customer service analytics matter only when they drive change, such as staffing decisions, knowledge articles, coaching priorities, or process workflows. The difference between teams that improve SLAs and FCR and teams that just report on them comes down to closing the loop from measurement to action.
Start with unified ticket-level data across all customer service channels. Build live dashboards that show current SLA and FCR performance by queue, intent, channel, and language. Establish a weekly rhythm where you review the numbers, assign specific fixes, and confirm previous changes worked.
Most improvements don’t require AI or advanced predictive customer behavior models. They just require consistency in tagging, discipline in reviewing, and accountability for taking action.
See BlueTweak in action. Book a 30-minute demo to explore unified customer service anal
Customer service analytics turns tickets, calls, chats, and emails into actions that improve SLA adherence and First Contact Resolution; BlueTweakunifies these signals, SLA by queue, FCR by intent and channel, transfer rates, quality scores, and CSAT, and connects them to scheduling, knowledge, routing, and coaching so operations can act in one place.
Live service level by queue, current backlog, forecasted volume versus scheduled agents, and first response time move SLAs the most, while resolution rate by intent and channel, transfer reasons, reopen rate, knowledge article usage, and resolution-completeness quality scores drive FCR; BlueTweak surfaces these KPIs with drill-downs to the underlying conversations so you can staff, fix content, or adjust processes quickly.
Build role-based dashboards where operations see live SLA status and predicted volume for staffing adjustments, and coaches see agent-level FCR, handle time, transfer patterns, and quality trends for targeted development; BlueTweak supports this cadence with queue views for ops, agent scorecards for coaching, and action tracking so weekly reviews translate directly into owners, next steps, and measurable outcomes.
A practical example is Workforce Management forecasting: analyze historical ticket volume by hour, day, and week to predict next month’s demand and build staffing schedules that prevent SLA breaches; BlueTweak does this in its WFM and analytics, using patterns in your data to forecast demand and flag likely escalations so teams can fix upstream issues before they spike voice traffic and churn.
Track FCR by intent before and after each knowledge update, and look for a clear lift, for example, a 10+ percentage-point improvement on “refund policy” within two weeks; BlueTweak links article edits to intent-level FCR and shows agent and customer usage so you can see whether the change worked or if discoverability, not content, is the blocker.
As Head of Digital Transformation, Radu looks over multiple departments across the company, providing visibility over what happens in product, and what are the needs of customers. With more than 8 years in the Technology era, and part of BlueTweak since the beginning, Radu shifted from a developer (addressing end-customer needs) to a more business oriented role, to have an influence and touch base with people who use the actual technology.
Quality
Administration
Workforce Management
Customer Support Analytics
Copyright BlueTweak 2025