


TL;DR
A strong customer support survey template turns quick, reliable feedback into operational wins. Use short, journey-aware surveys with clear scales, tie every response to a ticket or intent, segment by channel and language, and close the loop publicly. The result is higher first contact resolution (FCR), faster SLA recovery, and rising customer satisfaction, because you’re measuring what matters and acting on it.
Why Surveys Drive SLAs and FCR in 2026
Surveys are not a vanity exercise; they are the fastest way to measure customer satisfaction, find friction by customer journey stage, and tune the playbooks that determine response time and resolution. When you standardize a customer service survey template and wire it into your customer service reporting process, you get consistent customer satisfaction data that shows where SLAs slip, where guides or macros fail, and which queues need coaching, without waiting for quarterly reviews.
The urgency is real. In 2026, only about three in ten customers provide direct feedback at all, which means the surveys you do send must be short, well-timed, and embedded at the moment of resolution to capture a signal you can act on. Design for low effort, close the loop, and your survey program will surface the insights that actually move SLAs and first-contact resolution.
This article walks you through ready-to-copy customer support survey template options, CSAT/CES wording, channel-specific deployment tips, and a 30-day plan to tie results to SLAs, FCR, and your reporting cadence.
20 Tips on a Customer Service Survey Template to Boost SLAs and FCR
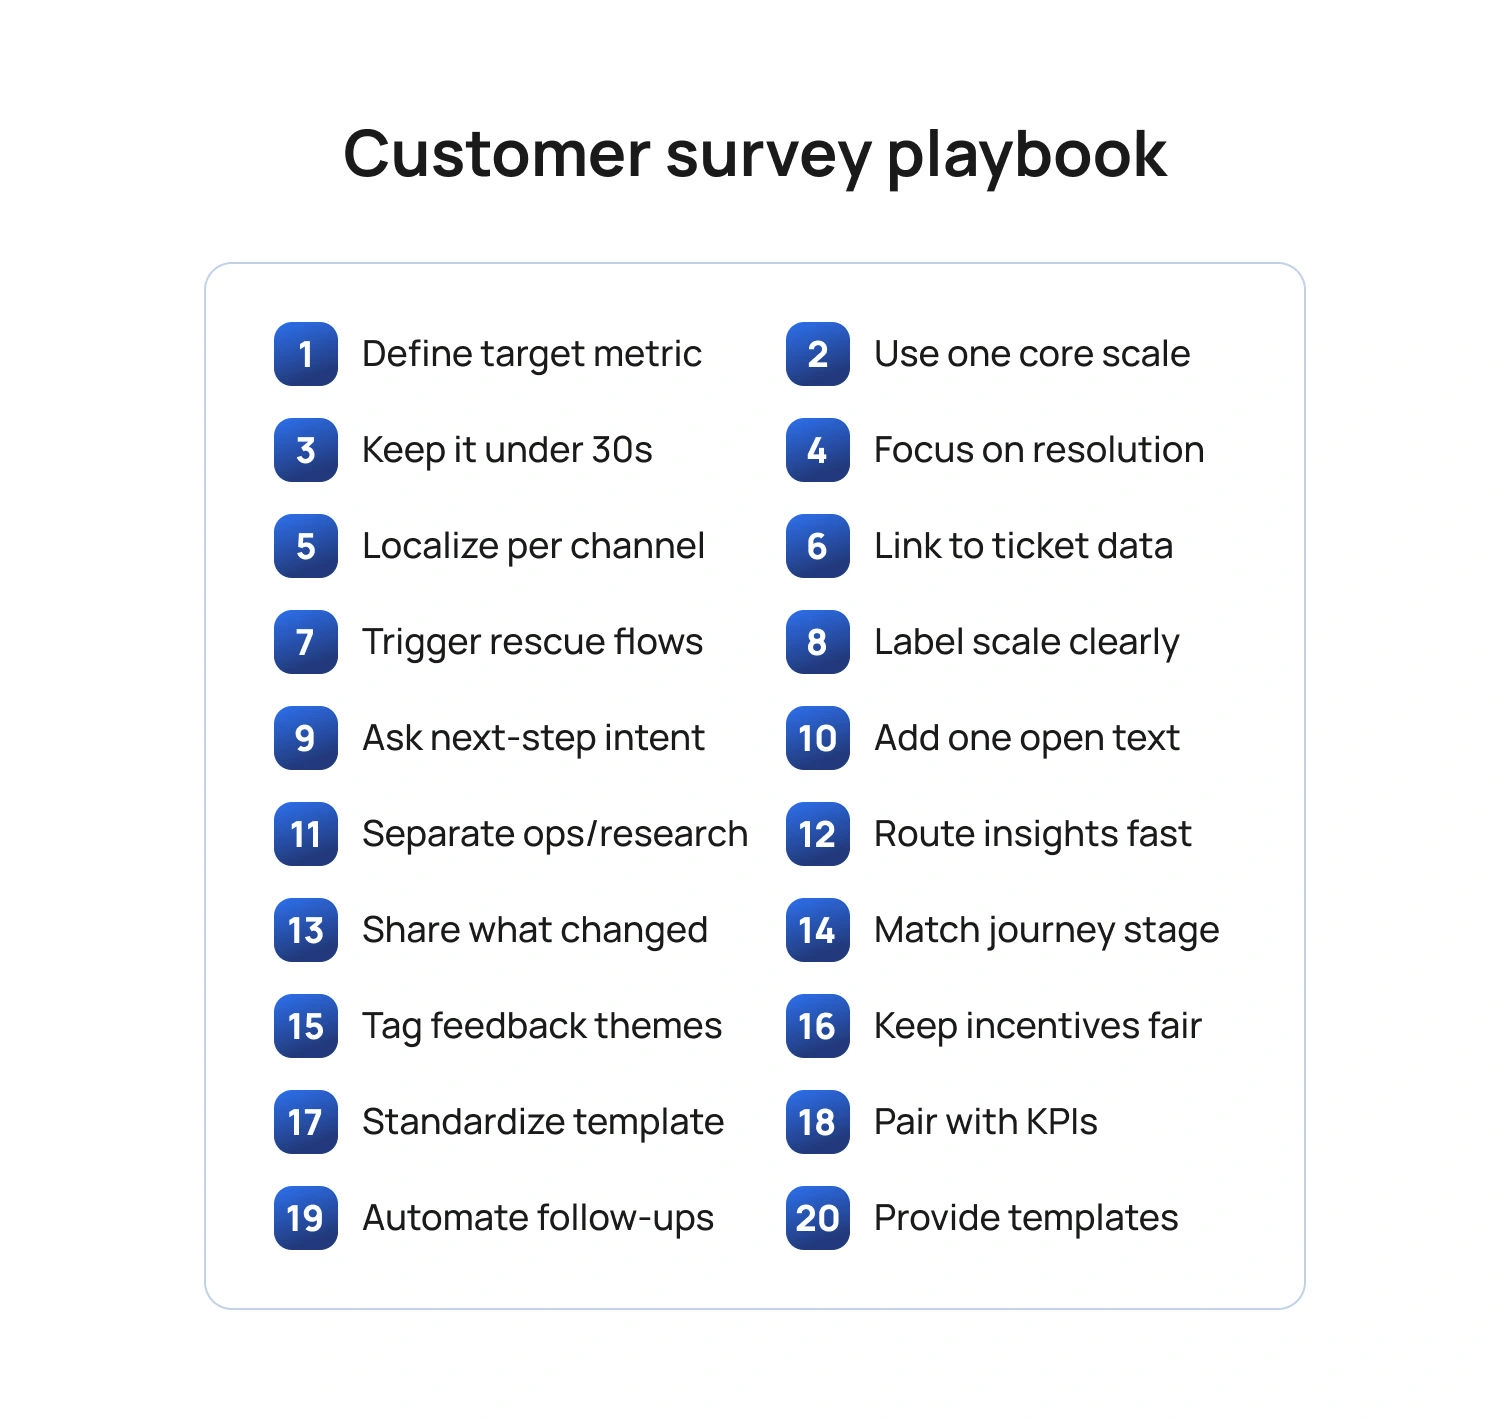
Below are 20 tips you can apply immediately. Each tip references template structure, wording, or analytics so you can adapt any sample customer service survey templates you already use or adopt the template at the end of this article.
Tip 1: Start with the outcome you want to improve
Before you pick questions, choose the SLA or FCR outcome you intend to move. If your average response time is the issue, ask about the clarity and speed of initial responses. If reopen rates are high, ask whether the answer solved the problem in a timely manner and whether follow-up was needed. Keeping the outcome explicit prevents bloated forms and keeps effective customer service reports focused on change, not raw numbers.
Template cue: Add a one-line purpose note at the top of your template customer service survey: “This two-question survey helps us resolve issues faster next time.”
Tip 2: Use one core metric per survey
Pick one metric based on the moment in the customer journey.
- CSAT (customer satisfaction score) right after a resolved interaction measures overall satisfaction with that specific service experience.
- CES (Customer Effort Score / Customer Effort Score CES) after a multi-step fix tells you how much effort the customer spent.
- NPS (net promoter score) belongs in lifecycle research, not as a post-ticket reflex.
Template cue: Your customer service satisfaction survey template should contain exactly one scale question (CSAT or CES) plus one open ended questions prompt for context.
Tip 3: Keep it under 30 seconds
Short surveys get more responses and cleaner data. Use a single Likert scale question item (e.g., 1–5 satisfaction levels) and one text box for additional comments. Save multi-topic batteries for research panels.
Template cue: “On a scale of 1–5, please rate your overall customer satisfaction with how our support team handled this request.”
Tip 4: Ask about the job, not the agent’s personality
Customers judge service delivery on clarity, speed, and completeness. Ask whether the customer pain points were resolved, whether the instructions were easy to follow, and whether another contact was needed. You can still celebrate outstanding performance by inviting an optional shout-out, but keep the core evaluation tied to contact resolution and resolution times.
Template cue: “Did this interaction fully resolve your request?” (Yes/No). If “No,” branch to “What was missing?” with multiple choice for “needed faster response,” “instructions unclear,” “handoff loop,” plus additional questions free text.
Tip 5: Localize by channel and language
Email, chat, voice, and social have different norms. A one-question customer service template survey can be embedded in chat; SMS needs a URL that's brief; email can include a second question. Localize wording so customers feel it is in their voice, and translate scales carefully so “satisfied” maps consistently across locales.
Template cue: Maintain channel-specific survey templates in your library and store translations centrally; keep the scale anchors identical to protect comparability across the reporting period.
Tip 6: Tie every response to a ticket, intent, and owner
A perfect customer service survey with no context won’t help you identify areas for continuous improvement. Join the survey data to the ticket ID, the detected intent, the product area, and the agent or queue. This lets you cut survey results by support agent, feature, or locale, and connect low scores to coaching or documentation gaps.
Template cue: Add hidden fields for ticket, queue, language, and product so customer service reports and key metrics roll up cleanly.
Tip 7: Make “negative feedback” easy to give and easy to fix
Treat a low score as a rescue opportunity. Offer a one-click callback or reopen button on online surveys when CSAT ≤ 2 or CES ≥ 4. That move saves churn and shows you take customer expectations seriously.
Template cue: “Want help right now? Tap to reopen this case.” Route to a senior agent pool with the full transcript attached.
Tip 8: Use plain scales and label the endpoints
Avoid cryptic anchors. Use “Very satisfied” to “Very dissatisfied” for CSAT and “Very easy” to “Very hard” for CES. Labeling endpoints reduces scale confusion and increases the quality of customer satisfaction survey data.
Template cue: Include examples below the scale that reference your service context, such as “Very easy: I followed one article and was done.”
Tip 9: Ask one behavior question about next steps
A small behavior question predicts customer loyalty better than adjectives alone. After CSAT, ask if the customer would use self-service next time, or if they needed to contact the centers again. This links satisfaction to the future cost of service.
Template cue: “If you face this issue again, would you use our help center first?” (Yes/No). Track shifts after you improve survey templates or content.
Tip 10: Close with one powerful open text prompt
Use a single, well-aimed open ended questions prompt to capture valuable feedback: “What is one thing we could have done to resolve this faster?” This gives you usable phrasing for macros, troubleshooting guides, and customer service operations playbooks.
Template cue: Cap at 300 characters to keep responses tight and analyzable.
Tip 11: Offer “free templates” thoughtfully
If you publish free templates or give customers a free account to leave feedback, keep the post-ticket survey tiny and push longer research to a voluntary panel. Mixing research and service slows completion and hurts response rates.
Template cue: Auto-invite existing customers who opt in to a quarterly research panel for deeper survey questions on the customer experience and brand perceptions.
Tip 12: Automate the handoff from insight to action
A survey that no one reads will not enhance SLAs or FCR. Route low CSAT or high CES to owners, log fixes in your release notes or knowledge base, and show impact in your monthly report. When customers see their suggestions reflected publicly, loyalty grows.
Template cue: Add a light action plan to your dashboard: “Top 3 friction points, owner, due date, expected impact on FCR or average time to resolve.”
Tip 13: Share what you changed
Publicly closing the loop increases future survey participation and trust. Post “You said, we did” notes in your help center and include key findings in customer emails. This aligns survey work with business growth goals and makes surveys feel worthwhile to respondents.
Template cue: “We reduced waits in billing chat by 22% after your feedback about queue spikes.”
Tip 14: Use templates that match the journey stage
Keep a library of customer satisfaction survey templates that map to moments: post-ticket CSAT/CES, post-onboarding CSAT, and quarterly NPS. Reuse proven language to reduce noise and improve trend integrity across the reporting period.
Template cue: Maintain a short “When to use which customer survey” guide so agents and automation can trigger the right version.
Tip 15: Analyze words, not just numbers
Scale scores tell you satisfaction, but words reveal pain points. Use lightweight text tagging to group feedback into specific areas like billing, setup, reliability, and tone. Report the top three drivers of low CSAT and high CES, along with the numbers.
Template cue: Add tags like “unclear steps,” “handoff,” “policy block,” and “slow reply” to your insights board.
Tip 16: Keep incentives ethical and neutral
If you reward participation, avoid wording that biases results. Offer entry into a generic drawing rather than discounts tied to positive feedback. Your aim is accurate measurement to identify areas for improvement, not inflated scores.
Template cue: “Complete in 20 seconds for a chance to win a gift card; your honest feedback helps us improve.”
Tip 17: Separate FCR diagnostics from brand research
Do not bury FCR fixes inside a 15-minute brand study. Post-ticket surveys should be surgical; save research about value, purchase drivers, and perception for occasional projects. This keeps service metrics actionable for the support team and protects response rates.
Template cue: Tag service surveys with “operational” and brand studies with “research” to keep teams clear on use.
Tip 18: Standardize your template and naming
Consistency produces trustworthy trends. Give each market a shared customer service survey template: same scales, same anchors, same routing rules. This lets you compare the same period across regions, queues, or individual team members without the headache of cleaning.
Template cue: Store the master customer service survey template in your design system with tokens for brand, locale, and channel.
Tip 19: Combine survey data with operational KPIs
On your dashboard, pair CSAT or CES with resolution rates, FCR, ticket volume, and SLA attainment. When you plot customer satisfaction against workload and staffing, you expose trade-offs and justify investments that help the team respond faster.
Template cue: “For Password Reset intent, CSAT 4.6, FCR 89%, SLA 98%” next to “For Billing Dispute, CSAT 3.8, FCR 52%, SLA 72%.”
Tip 20: Provide a ready-to-use template set
Below is a simple bundle you can copy into your tool. It covers your required phrases and remains short enough to keep completion high.
Post-resolution CSAT (customer service survey template)
- On a scale of 1–5, how satisfied are you with how we resolved your issue today? (customer satisfaction score)
- Did this interaction fully resolve your request? (contact resolution)
- What is one thing we could have done to resolve this faster? (open text)
Post-resolution CES (customer service satisfaction survey template)
- It was easy to resolve my issue. 1–5 (customer effort score)
- If you face this again, would you use our help center first? Yes/No
- What made this easy or hard? (additional comments)
Library callouts
- A concise customer support survey template for chat.
- A two-question customer service template survey for voice follow-up.
- A one-page PDF of sample customer service survey templates for teams to review in training.
- A minimalist template customer service survey for SMS with a single scale and an optional link to comment.
- A web form titled "customer support satisfaction survey template for email automations."
Implementation Plan in 30 Days
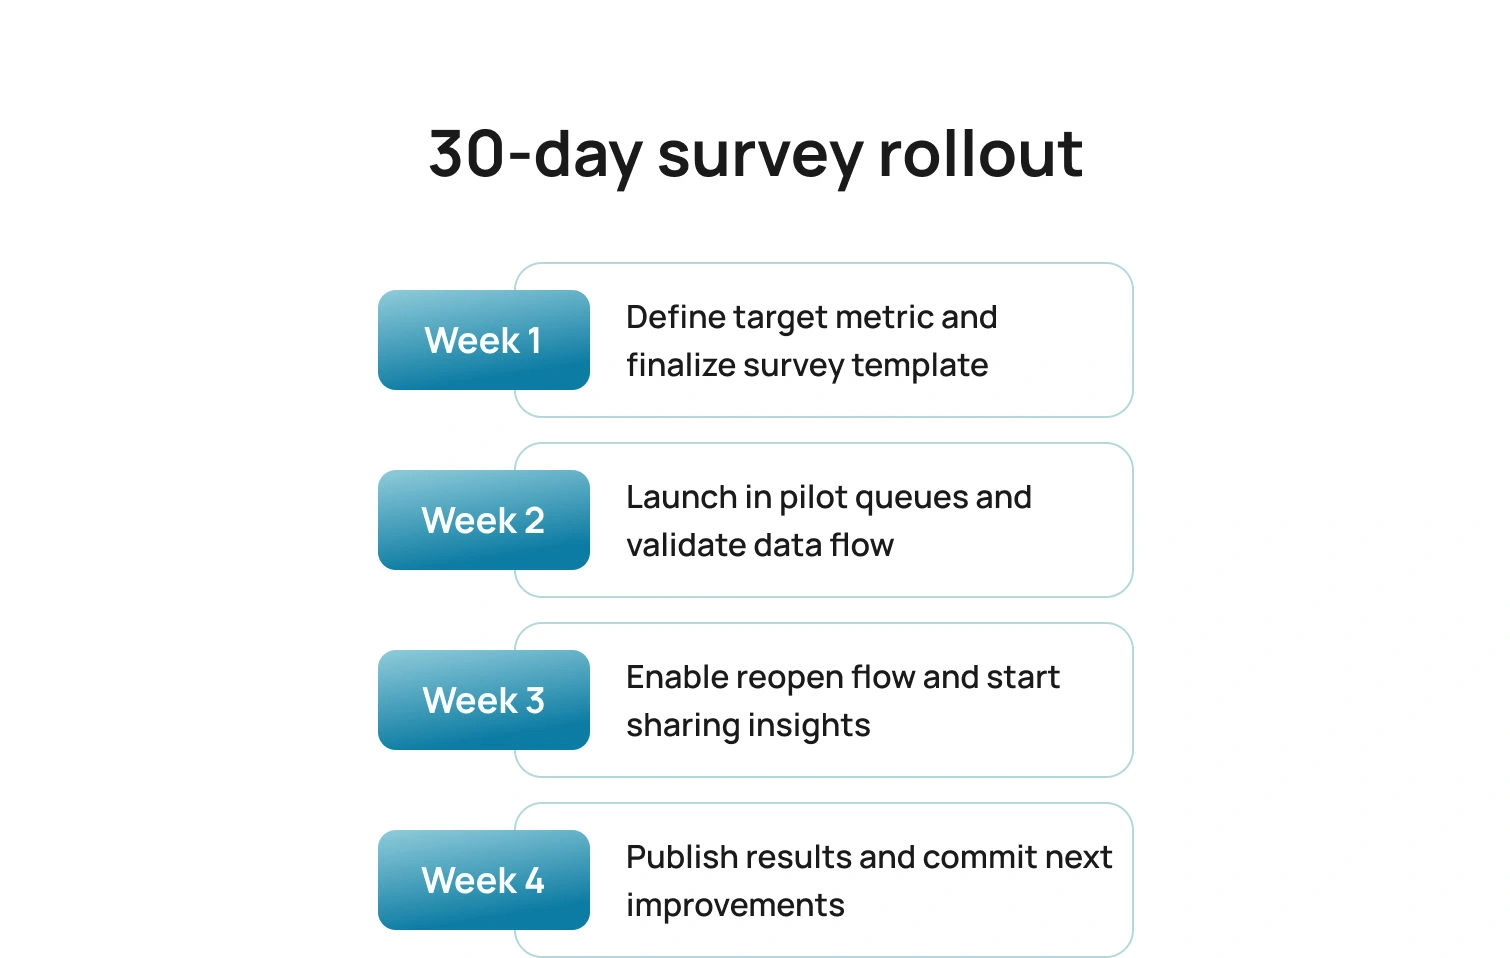
Here is a simple rollout that delivers signals quickly, proves impact, and builds the habit of acting on survey results without adding overhead.
Week 1: Choose CSAT or CES per journey stage; finalize the core survey templates; define hidden fields.
Week 2: Launch in one or two queues; validate routing and data joins; confirm scale wording in all locales.
Week 3: Add the reopen button for low scores; start the “You said, we did” cadence.
Week 4: Publish your first mini customer support report with CSAT/CES, top themes, and the two changes you will ship before the next reporting period.
Pitfalls To Avoid
Even well-designed survey programs can miss the mark if signals are mixed, scales are inconsistent, or results never translate into action. Keep these common traps in view as you roll out and refine your templates.
- Mixing NPS with post-ticket CSAT or CES dilutes the signal.
- Asking five questions to fix a one-question problem slows completion and adds noise.
- Failing to translate and localize scales breaks comparability across regions.
- Publishing free templates that your frontline cannot deploy creates confusion and slows adoption.
- Reporting scores without actions wastes trust, so always include owners and dates.
How BlueTweak Helps (Without Changing Your Survey Tool)
BlueTweak brings a multilingual chatbot, a multilingual voicebot, email, and SMS into a single workspace, so post-ticket surveys can be triggered from one reliable place. Your existing survey platform stays in place. BlueHub coordinates timing and channel, so invitations arrive at the moment of resolution, not hours later.
Context travels with every response. Through APIs and webhooks, each survey is tagged with ticket ID, intent, language, queue, and brand. The result is a customer service report with clean joins, per intent views of CSAT and CES, and no manual stitching.
Analysis becomes faster and clearer. AI-generated summaries and AI customer sentiment analysis flags condense long comments into themes the team can act on, while unusual responses surface for review. When SLAs or FCR dip, you have text evidence to explain why and where to intervene.
Operational visibility sits next to feedback. WFM and analytics place CSAT and CES alongside SLA attainment, first reply time, and FCR for the same purposes, making it clear whether a content update, staffing change, or coaching plan will move the metric.
Governance supports trust. Role-based access, audit logs, and edit history keep the reporting trail defensible and show how a comment led to a macro change or a knowledge article revision.
Conclusion
A thoughtful customer support survey template does more than collect opinions; it accelerates fixes that customers can feel. Keep surveys short, specific, and journey-aware. Join scores to tickets and intents. Share what changed. When you treat feedback as fuel for operations, SLAs recover faster, FCR rises, and satisfied customers become loyal customers.
Ready to operationalize this end-to-end? BlueHub ties survey outcomes to staffing, routing, and knowledge updates in one place. Book a BlueTweak demo to see how it fits your stack and boosts SLAs and FCR.

As Head of Digital Transformation, Radu looks over multiple departments across the company, providing visibility over what happens in product, and what are the needs of customers. With more than 8 years in the Technology era, and part of BlueTweak since the beginning, Radu shifted from a developer (addressing end-customer needs) to a more business oriented role, to have an influence and touch base with people who use the actual technology.


