



TL;DR
Call center KPI benchmarks help you set realistic targets, identify performance gaps, and guide investment decisions. In 2026, key benchmarks include service level, average speed to answer, abandonment rate, first call resolution, customer satisfaction, customer effort score, average handle time, after-call work, transfer rate, repeat calls, occupancy and utilization, schedule adherence, forecast accuracy, cost per contact, and self-service containment. Treat every number as a range shaped by channel, industry, customer intent, and complexity, rather than a single magic target. Pair call center metrics with root-cause analysis and a clear action plan to improve customer satisfaction, operational efficiency, and team performance.
Are your call center KPIs actually telling you that performance is good, or have you simply gotten used to the numbers you see every day?
Without reliable call center benchmarks, it's difficult to know whether a 30-second average speed to answer is strong, whether a 10% abandonment rate is a warning sign, or whether your first call resolution rate is keeping pace with customer expectations. Teams can end up optimizing for the metrics that are easiest to improve rather than the ones that have the greatest impact on customer experience, service quality, and operational costs.
That's where call center benchmarking can help. By comparing your performance against credible external benchmarks, your own historical data, and relevant industry or channel context, you can identify meaningful gaps and set targets that reflect how your contact center actually operates.
Why Call Center KPI Benchmarks Matter in 2026
Customer expectations for fast, consistent support continue to rise, but that doesn't mean every call center should aim for the same numbers. A 20-second average speed to answer might be excellent for one operation and unrealistic for another, depending on call volume, customer intent, staffing levels, service model, and the complexity of customer issues.
That's why call center KPI benchmarks are more useful as reference ranges than fixed targets. Comparing your performance with external benchmarks can show where your center is performing well and where there's room to improve, while comparing results over time shows whether those improvements are actually working.
The right benchmarks also help call center managers avoid optimizing one metric in isolation. For example, pushing agents to answer calls faster might improve average speed to answer, but if it leads to rushed interactions, lower first call resolution, or more repeat calls, overall center performance may suffer. Similarly, reducing average handle time isn't necessarily an improvement if agents don't have enough time to properly address customer issues.
A balanced approach looks at operational and customer-focused KPIs together. Service level, average speed to answer, and abandonment rate can show how quickly customers connect with an agent. First call resolution, customer satisfaction, and customer effort score reveal what happens during and after the interaction. Metrics such as occupancy, schedule adherence, cost per contact, and self-service containment provide additional context on staffing, efficiency, and service costs.
In 2026, this context is particularly important as call centers increasingly manage a mix of voice and digital channels, automation, and self-service options. A benchmark that makes sense for incoming calls may not apply to chat or messaging, while a target for a simple account query may be inappropriate for a complex technical or high-value customer interaction.
The goal, then, isn't to match the average performance of other call centers. It's to use reliable call center benchmarks as a starting point, then adjust them to your industry, channel, customer preferences, and intent mix. BlueTweak can help connect those performance measures with the underlying customer interactions, giving teams more context when it's time to understand why a KPI is moving and what to do next.
The 15 call center KPI benchmarks below provide a practical starting point for setting those targets. Each benchmark should be treated as a directional range, rather than a universal standard, and reviewed alongside the other KPIs that shape customer experience and center performance.
How to Use Call Center KPI Benchmarks
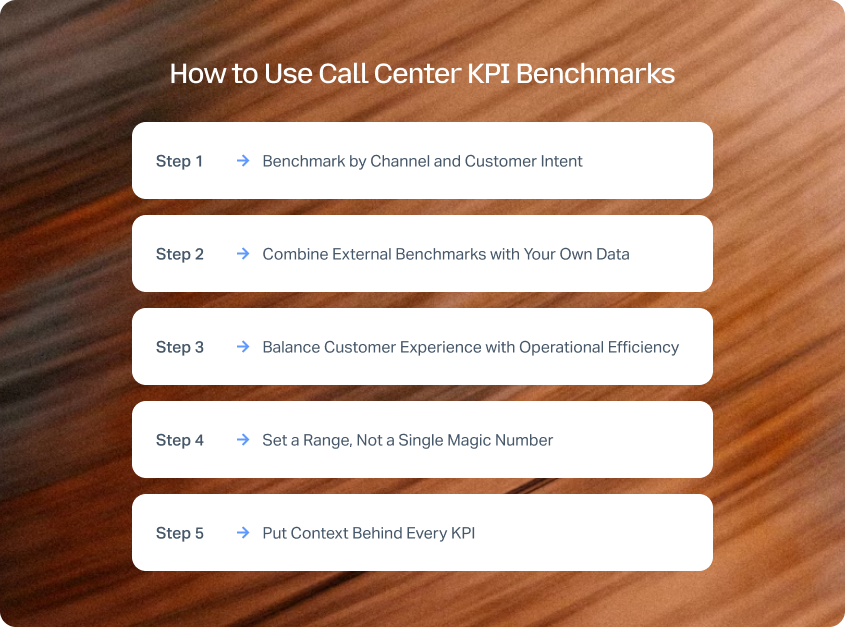
Treat call center KPI benchmarks as a playbook, not a scoreboard. An external benchmark can tell you where your performance sits relative to a wider market, but it can't tell you what your individual contact center should achieve. Your targets need to reflect your customers, channels, call volumes, service model, and the types of issues your agents handle.
Use the following principles to turn benchmark data into useful targets:
1. Benchmark by Channel and Customer Intent
Voice, chat, email, social, and messaging have different customer behaviors, response expectations, and cost structures. A call center benchmark for average speed to answer won't translate directly to an asynchronous channel, while a target for a simple account query may not be appropriate for a complex technical issue. The same principle applies when you're evaluating help desk performance, where metrics and targets may differ from those used for a voice-focused call center.
Where possible, segment your call center metrics by channel and intent. This gives you a more meaningful view of center performance and helps you identify which customer interactions are driving the biggest gaps.
2. Combine External Benchmarks with Your Own Data
Industry benchmarks provide a useful reference point, but your historical performance shows what's realistic for your operation. Compare benchmark ranges with at least four to six recent reporting periods to identify meaningful trends rather than reacting to a single month's results.
You can also compare performance with direct competitors when reliable data is available. The goal isn't to copy another center's numbers, but to understand how your performance compares and whether your current targets are appropriately ambitious.
3. Balance Customer Experience with Operational Efficiency
Don't optimize a single KPI at the expense of the wider customer journey. For example, reducing average handle time may appear positive until it results in lower first call resolution, more repeat calls, or poorer customer satisfaction.
Read customer-focused measures such as customer satisfaction, customer effort score, and first call resolution alongside operational measures such as service level, occupancy, average handle time, cost per contact, and self-service containment. Together, these call center KPIs give you a clearer picture of whether center performance is improving without creating new problems elsewhere.
4. Set a Range, Not a Single Magic Number
A useful benchmark should give your team room to distinguish between acceptable, target, and exceptional performance. Instead of setting one fixed number, establish a floor, target, and stretch goal for each KPI.
For example, a center might define an acceptable service level, a target service level, and a more ambitious stretch target. These ranges can then be adjusted when customer expectations, call volumes, staffing, seasonality, or business priorities change.
5. Put Context Behind Every KPI
A number alone doesn't explain why performance changed. When reviewing a benchmark, document what moved, why it moved, and what action should follow.
For example, an increase in abandonment rate could point to higher call arrival rates, insufficient staffing, a poorly designed interactive voice response (IVR) flow, or longer handling times. Understanding the cause turns benchmarking from reporting into a practical tool for improving call center operations.
Top 15 Call Center KPI Benchmarks for 2026
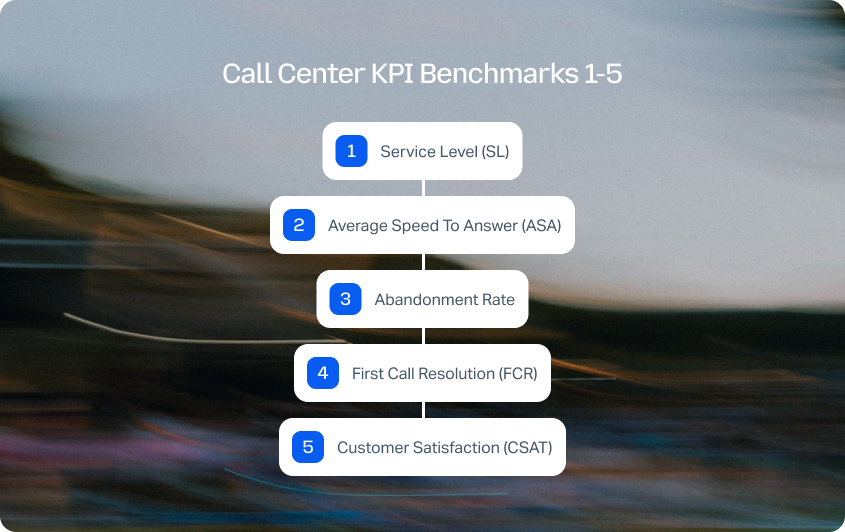
The benchmarks below are practical reference ranges rather than universal rules. Actual performance varies by industry, channel, customer intent, call complexity, staffing model, and seasonality. Use them to establish a baseline, then adjust your targets to reflect the customers and interactions your center handles.
Call Center KPI Benchmarks at a Glance
Sources and methodology: ContactBabel’s US Contact Center Decision-Makers’ Guide provides recurring industry data on service levels, abandonment, staffing, and contact-center operations; COPC’s CX Standard emphasizes defined measurement methods and customer-experience outcomes; NICE’s workforce-management guidance and Calabrio’s workforce-management resources discuss occupancy, adherence, forecasting, and staffing trade-offs; SQM Group’s first-call-resolution research covers FCR measurement; and MetricNet’s benchmarking resources explain why cost and service benchmarks should be normalized by operating model.
Where a body publishes a fixed figure (e.g. SQM Group's FCR research), we've cited it directly. Where no single body publishes an annual, cross-industry number, we describe the KPI as having no universal benchmark and point to the definitional factors that make one meaningless – based on the same sources' broader methodology guidance rather than a single dated figure.
1. Service Level (SL)
What it is: The percentage of calls answered within a defined threshold, such as 80% answered within 20 seconds.
Benchmark: 80/20 is a widely used planning convention, but it is not a universal industry standard. Set the target by queue, customer intent, staffing model, and cost of waiting. For digital channels, use response-time or resolution-time SLAs rather than a call-style speed threshold.
Why it matters: Service level shows whether your center is meeting its response-time promise. When calls aren't answered quickly enough, customers may abandon the queue, make repeat calls, or experience unnecessary friction.
Source: ContactBabel research; COPC CX Standard.
2. Average Speed to Answer (ASA)
What it is: The average time a customer spends waiting in the queue before an agent answers.
Benchmark: There is no dependable cross-industry ASA target that applies to every center. Use ASA with service level, abandonment rate, call arrival patterns, and customer value. A 20–40-second result may be reasonable for some mainstream voice queues, but it should be treated as an operating example rather than a universal benchmark.
Why it matters: ASA is one of the clearest indicators of how quickly customers can connect with your team. Rising wait times can increase abandonment and negatively affect customer interactions before an agent even says hello.
Source: ContactBabel research; NICE workforce-management resources.
3. Abandonment Rate
What it is: The percentage of incoming calls that disconnect before they're answered by an agent.
Benchmark: Many centers manage abandonment below 5%, but the figure is meaningful only when you define how short calls, IVR exits, callbacks, and technical disconnects are treated. Report the threshold used, such as abandonment after 10 or 30 seconds, and compare like with like.
Why it matters: A high abandonment rate can indicate excessive wait times, staffing gaps, call spikes, or friction in the IVR experience. It's both a customer experience signal and an operational warning that deserves investigation.
Source: ContactBabel research; COPC CX Standard.
4. First Call Resolution (FCR)
What it is: The percentage of customer issues resolved without a follow-up contact or transfer.
Benchmark: SQM Group's post-call survey research (based on over two decades of benchmarking North American contact centres) puts the all-industry average FCR at around 70%. It defines 70–79% as a "good" result and 80% or higher as "world-class" performance, a bar reached by roughly 5% of centres. Treat this as a directional benchmark rather than a fixed target: FCR is sensitive to how you define a repeat contact and the time window you measure it over, so lock your own methodology before comparing against it. Expect low-complexity intents (retail, general enquiries) to sit above the average and high-complexity or regulated intents (technical support, telecoms, claims) to sit meaningfully below it.
Why it matters: Strong first call resolution reduces repeat calls, lowers contact centre costs, and removes friction from the customer journey. It can also help agents spend more time addressing new customer issues rather than resolving the same issue repeatedly.
Source: SQM Group's First Call Resolution benchmarking blog.
5. Customer Satisfaction (CSAT)
What it is: A post-interaction measure of how satisfied customers are with their experience, commonly collected on a 1–5 or 1–7 scale.
Benchmark: There is no credible universal 80–90% CSAT standard because results depend on the question wording, response scale, survey channel, sampling, and definition of a satisfied response. Report the full methodology and use your own trend and segment comparisons as the primary benchmark.
Why it matters: CSAT provides a direct view of how satisfied customers are with individual interactions. Read it alongside operational KPIs to understand whether faster answers or shorter calls are actually producing better customer experiences.
Source: COPC CX Standard; Medallia customer-experience resources.
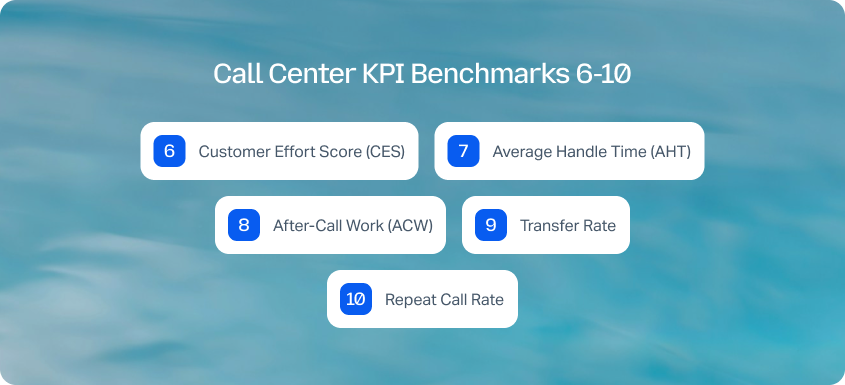
6. Customer Effort Score (CES)
What it is: A measure of how easy or difficult customers found it to resolve their issue, often captured by asking how much effort they had to put in.
Benchmark: Avoid presenting “fewer than 10–15% difficult responses” as a published universal benchmark. CES depends on the question and scale used. Choose one validated question, report the distribution or average, and compare results by journey, intent, and channel over time.
Why it matters: Customer effort highlights friction that satisfaction scores can miss. Customers may report being satisfied with an interaction while still having to navigate multiple steps, repeat information, or contact the company more than once.
Source: Medallia customer-experience resources; Qualtrics customer-experience resources.
7. Average Handle Time (AHT)
What it is: The total time spent handling a contact, including talk time, hold time, and after-call work.
Benchmark: There is no defensible universal AHT target. A 4–7-minute range may describe some general voice queues, but technical support, healthcare, financial services, and regulated interactions can require substantially longer. Benchmark AHT by channel, intent, complexity, and agent workflow.
Why it matters: AHT helps contact center leaders understand workload and staffing requirements. It shouldn't be optimized in isolation: reducing talk time at the expense of resolution or service quality can create more repeat calls and higher costs later.
Source: ContactBabel research; COPC CX Standard.
8. After-Call Work (ACW)
What it is: The time agents spend completing notes, updating records, or carrying out other tasks after a customer interaction ends.
Benchmark: No reliable cross-industry ACW range applies to every center. Compare ACW by interaction type and documentation requirement. A 30–90-second result may be appropriate for simple, well-integrated workflows, while regulated or complex contacts may require considerably longer.
Why it matters: Excessive ACW reduces agent availability and can indicate inefficient operational processes, excessive documentation, or gaps in call center software and workflows.
Source: NICE workforce-management resources; Calabrio workforce-management resources.
9. Transfer Rate
What it is: The percentage of contacts transferred to another agent, queue, or support tier.
Benchmark: There is no reliable universal 10–20% standard. Set a baseline by queue and transfer reason, then distinguish necessary specialist transfers from avoidable transfers caused by routing, training, or knowledge gaps.
Why it matters: Transfers add time and effort to the customer journey and can indicate problems with routing, agent training, knowledge access, or issue ownership.
Source: COPC CX Standard; ContactBabel research.
10. Repeat Call Rate
What it is: The percentage of customers who contact your center again about the same issue within a defined period.
Benchmark: Do not use 10–15% as a universal benchmark without defining the matching logic and time window. Measure repeat contacts using a consistent customer or case identifier, then segment results by issue, product, channel, and resolution status.
Why it matters: Repeat calls increase call volumes and service costs while creating additional effort for customers. Tracking them by issue or intent can reveal problems that a center-wide FCR figure might hide.
Source: SQM Group FCR resources; MetricNet benchmarking resources.
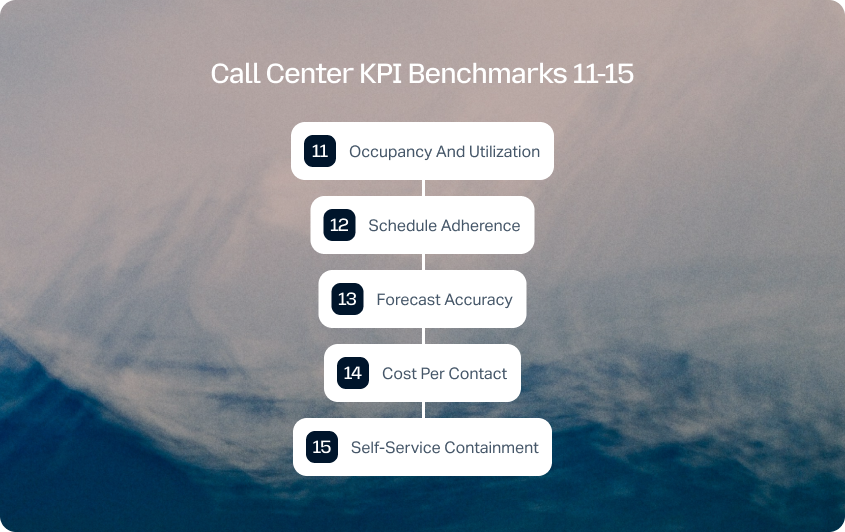
11. Occupancy and Utilization
What it is: Occupancy measures the proportion of an agent's logged-in time spent handling customer work rather than waiting for contacts. Utilization is a broader measure of how much of an agent's available time is spent on productive work.
Benchmark: Occupancy and utilization are widely used contact center workforce metrics, with benchmarks varying by operating model, interaction complexity, concurrency, and staffing approach. Some workforce-planning models use occupancy targets in the 80–85% range for sustained voice operations, but this should be treated as a planning reference rather than a universal performance standard.
Why it matters: High occupancy can indicate efficient use of staffing, but consistently excessive occupancy can contribute to fatigue, lower service quality, and burnout. The right target balances agent performance with sustainable workloads.
Source: ContactBabel research; COPC CX Standard; MetricNet benchmarking resources.
12. Schedule Adherence
What it is: The degree to which agents follow their planned schedules, including when they're available to handle customer interactions.
Benchmark: Schedule adherence is commonly benchmarked in the 85–95% range, but the appropriate target depends heavily on how adherence is defined, the measurement interval, and how approved exceptions are handled. Confirm your calculation method before comparing results with an external benchmark.
Why it matters: Schedule adherence connects workforce planning with actual center operations. When staffing doesn't match the planned schedule, service levels can deteriorate even when the original forecast was accurate.
Source: ContactBabel research; MetricNet benchmarking resources.
13. Forecast Accuracy
What it is: The difference between forecast and actual call volumes or workload, commonly measured using WAPE or MAPE.
Benchmark: There's no standard cross-industry target for forecast accuracy. It depends on the interval measured, forecast horizon, demand volatility, seasonality, channel, and whether the calculation uses volume, workload, or both. Report the error measure and interval alongside any result so it's comparable over time.
Why it matters: More accurate forecasts help contact center leaders align staffing with expected call arrival rates. Better forecasting can reduce both understaffing and unnecessary staffing costs while supporting more consistent service levels.
Source: No single benchmarking body publishes a standard target; compare against your own historical accuracy instead.
14. Cost per Contact
What it is: The total cost of operating a contact channel divided by the number of contacts handled.
Benchmark: There isn't a meaningful universal target because service costs vary substantially by industry, channel, labor model, complexity, and geography. Use a consistent fully loaded cost definition and compare cost per contact with FCR, repeat contacts, CSAT, service level, and channel mix.
Why it matters: Cost per contact connects center performance with operational efficiency. Tracking it alongside customer-focused KPIs helps leaders identify whether cost reductions are genuine efficiencies or simply shifting costs into repeat calls, transfers, or poor customer experiences.
Source: MetricNet benchmarking resources; ContactBabel research.
15. Self-Service Containment
What it is: The percentage of customer intents resolved through IVR, bots, a knowledge base, or other self-service options without agent involvement.
Benchmark: Do not treat 20–60% as a universal industry range. Containment depends on the number of eligible intents, automation maturity, channel mix, and how resolution is verified. Report containment by intent and validate it with successful resolution, repeat contact, escalation, and customer-effort data.
Why it matters: Effective self-service reduces avoidable incoming calls and gives agents more capacity to handle complex customer issues. However, containment should only count as a success when customers actually get the outcome they need, rather than being prevented from reaching an agent.
Source: COPC CX Standard; NICE customer-experience resources; MetricNet benchmarking resources.
Call Center KPI Benchmarks by Industry
The right call center benchmarks depend heavily on the customers you serve and the issues your agents handle. For example, a financial services contact center dealing with fraud alerts has different customer expectations and compliance requirements from an e-Commerce team handling order status questions.
Use the following call center KPI benchmarks by industry as starting points, then adjust them based on customer intent, channel, complexity, seasonality, and business priorities.
The ranges below extend the general benchmarks above to reflect the risk, regulation, and seasonality typical of each sector. They are starting points for your own floor/target/stretch ranges, not industry-specific research findings.
Retail and e-Commerce
Customer context: Order status, returns, payments, promotions, and delivery issues.
Starting targets: For voice, an 80/20 service level and 20–30-second ASA can provide a useful starting point, alongside an abandonment rate of 5% or lower, FCR of 75–85%, and CSAT of 85–90%.
What to watch: Call volumes can spike around product launches, promotions, and holidays. Offering self-service options for order tracking and returns can reduce repeat calls while giving agents more time to handle complex issues.
Banking, Financial Services, and Insurance
Customer context: Authentication, fraud, claims, payments, policy changes, and other high-risk interactions.
Starting targets: A service level of 80/20 or faster can be appropriate for priority queues, with ASA of 20 seconds or less for urgent intents and an abandonment rate around 3–5%. FCR may sit around 70–80%, depending on issue complexity and compliance requirements.
What to watch: Transfers may be necessary for certain regulated or specialist interactions. Measure AHT alongside quality and resolution metrics rather than encouraging agents to rush complex customer queries.
Technology and SaaS
Customer context: Product setup, billing, troubleshooting, integrations, and technical support.
Starting targets: A 75/30 service level can be a reasonable baseline for general support, with faster response times for VIP customers or critical incidents. FCR may range from 70–85%, while technical interactions can push AHT toward 7–12 minutes. CSAT targets of around 85–90% can provide a useful reference point.
What to watch: Knowledge freshness and guided workflows can have a significant effect on first call resolution. Track repeat calls by product area or issue type to identify recurring customer problems.
Healthcare and Life Sciences
Customer context: Appointments, benefits, medication questions, eligibility, and other sensitive interactions.
Starting targets: An 80/20 service level or stricter target may be appropriate depending on the service and regulatory requirements. Abandonment should generally remain around 3–5%, while CSAT of 88% or higher can provide a useful starting point for resolved contacts.
What to watch: Compliance, privacy, and the complexity of customer issues can extend AHT and after-call work. Measure clarity, empathy, and resolution alongside speed to assess service quality.
Travel and Hospitality
Customer context: Bookings, cancellations, changes, disruptions, and loyalty-related issues.
Starting targets: Benchmarks should account for significant seasonality and demand spikes. An ASA of around 20–40 seconds, FCR of 70–80%, and abandonment of approximately 5–8% can provide directional starting points, with service levels adjusted around major events or disruption periods.
What to watch: Proactive messaging and self-service can reduce spikes in incoming calls. Track the wider customer journey when an issue spans multiple interactions or channels rather than evaluating individual calls in isolation.
Utilities and Telecom
Customer context: Outages, billing, activation, account management, and service issues.
Starting targets: An 80/20 service level can provide a baseline for normal demand, with FCR around 70–85% and strong self-service containment for routine status and account queries.
What to watch: Separate incident-related traffic from routine customer service when evaluating center performance. An outage can dramatically change call arrival rates and abandonment, making normal benchmarks misleading if both types of traffic are combined.
Journey-Lens Benchmarking
Looking at individual center metrics can tell you where performance is changing, but it doesn't always explain what the customer experienced. A voice SLA, chat response time, or average handle time can look healthy in isolation while customers still struggle to get their issues resolved.
Journey-lens benchmarking connects individual call center KPIs to the wider customer journey. Instead of asking whether one interaction met its target, ask whether the customer ultimately got the outcome they needed with as little effort and repetition as possible.
Use this lens to evaluate four areas:
- Cross-channel resolution: Did the customer get a resolution across the entire conversation, even if it moved between voice, chat, email, or messaging?
- Effort across steps: Did customers have to repeat information, switch channels, or contact the center multiple times to resolve the issue?
- Time to outcome: How long did it take from the start of the customer's issue to a successful resolution, rather than simply measuring the length of one call?
- Containment quality: Did self-service actually resolve the customer's issue, or did it simply delay an eventual agent interaction and increase customer effort?
This approach helps contact center leaders avoid optimizing individual metrics at the expense of customer experience. For example, a lower AHT isn't necessarily an improvement if customers then make repeat calls, while higher self-service containment isn't a success if customers still need to contact an agent to complete the journey.
The aim is to benchmark the outcome as well as the interaction, so your targets reflect both center performance and what matters to customers.
How to Run a Call Center Benchmarking Process
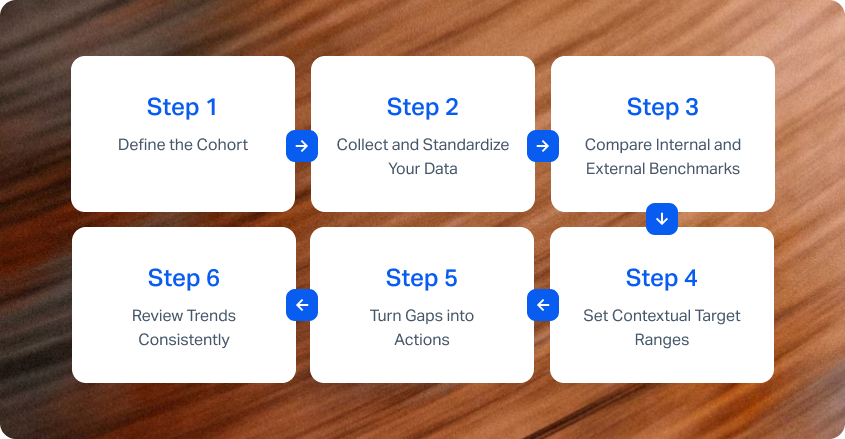
Call center benchmarking works best as a repeatable process rather than a one-time comparison. Once you've established your benchmark ranges, use the same definitions, cohorts, and reporting periods consistently so you can distinguish genuine performance changes from changes in measurement.
1. Define the Cohort
Choose the period, channel, queue, and customer intents you're comparing. Where possible, compare like with like, such as the same period last quarter or last year, rather than comparing a normal trading period with a seasonal peak.
2. Collect and Standardize Your Data
Confirm that everyone is using the same definitions for calls answered, transfers, repeat calls, after-call work, and other key performance indicators. Check for missing data, changes in routing, and other factors that could distort the comparison.
3. Compare Internal and External Benchmarks
Compare your current performance with the relevant call center benchmark and your own historical results. If reliable competitor data is available, use it as an additional reference point. Don't assume that being above or below an industry average automatically means your performance is good or bad.
4. Set Contextual Target Ranges
Turn each benchmark into a floor, target, and stretch range based on your channel, customer intent, complexity, and business priorities. Review those ranges when call volumes, staffing, seasonality, customer expectations, or service models change.
5. Turn Gaps into Actions
A benchmark only becomes useful when it changes what your team does. For each significant gap, identify the likely cause, assign an owner, set a deadline, and define the expected impact.
For example, rising abandonment might require changes to staffing, IVR design, callback options, or routing. A fall in FCR could point to knowledge gaps, insufficient agent training, or a recurring product issue. The action should address the cause rather than simply trying to push the KPI back into range.
6. Review Trends Consistently
Report progress weekly or monthly, depending on the KPI, and revisit target ranges quarterly or when there's a significant operational change. Focus on trends rather than isolated results, and record what changed and why so your call center benchmarking remains useful over time.
Common Pitfalls in Call Center KPI Benchmarking
Benchmarking can create a false sense of performance when teams compare the wrong data or focus too heavily on a single number. Avoid these common mistakes:
- Treating an industry average as a universal target. External benchmarks provide context, but your targets should reflect your customers, channels, and operating model.
- Mixing metric definitions. A change in how you calculate FCR, abandonment, or repeat calls can make a KPI appear to improve when the measurement itself has changed.
- Optimizing one KPI in isolation. Improving AHT, occupancy, or service level can create problems elsewhere if customer satisfaction, resolution, and effort aren't monitored alongside it.
- Ignoring channel and intent differences. Voice, chat, email, and messaging have different customer expectations, while simple and complex customer queries require different service models.
- Benchmarking without investigating the cause. A KPI shows you where performance has changed, but not necessarily why. Pair performance data with customer interactions and operational context to identify the underlying issue.
- Setting targets without owners. A benchmark won't improve center performance unless someone is responsible for understanding gaps and taking action.
- Using snapshots instead of trends. One unusual week can distort a KPI. Compare consistent reporting periods and account for seasonality, campaigns, outages, and other demand changes.
A 90-Day Plan to Operationalize Your Benchmarks
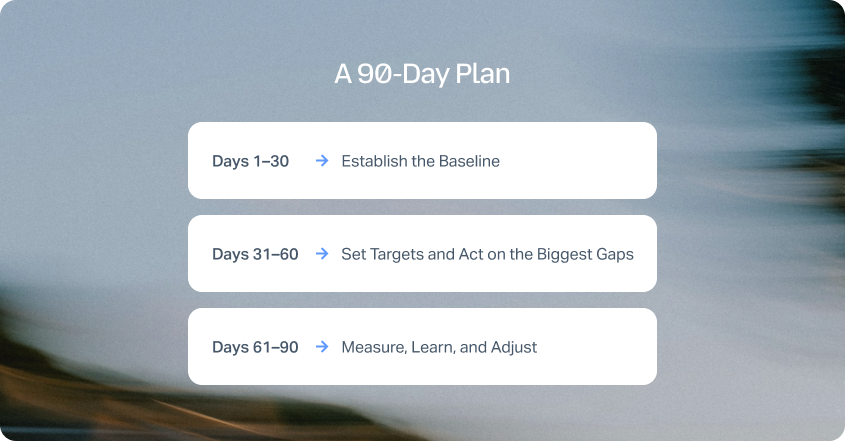
Once you've established your call center KPI benchmarks and target ranges, the next step is turning them into a regular operating habit. A 90-day rollout gives teams enough time to establish a baseline, introduce new targets, and measure whether the resulting changes are working.
Days 1–30: Establish the Baseline
Lock your metric definitions and collect at least 12 months of historical data where available. Segment current performance by channel and your highest-volume or highest-value intents, then identify the biggest gaps against your chosen benchmarks.
Agree on three to five priority KPIs for the first quarter, such as customer satisfaction, first call resolution, abandonment rate, or service level. Avoid trying to improve every metric at once.
Days 31–60: Set Targets and Act on the Biggest Gaps
Set floor, target, and stretch ranges for each priority KPI. Identify the likely causes behind the largest gaps, then create focused playbooks for the changes most likely to improve performance.
Depending on the problem, that could include staffing changes, routing adjustments, knowledge improvements, self-service options, or agent training. Give each action an owner and a deadline, and review progress at a consistent weekly cadence.
Days 61–90: Measure, Learn, and Adjust
Compare performance against your new targets and look for sustained changes rather than one-off improvements. Include customer feedback alongside quantitative center performance metrics to understand whether operational gains are translating into better customer experiences.
Highlight the biggest wins and remaining risks each week, then adjust targets where customer intent, seasonality, call volumes, or the operating model has changed. At the end of the 90 days, document what changed, why it changed, and which benchmarks should become part of the next quarter's operating plan.
The goal isn't to complete benchmarking after 90 days. It's to establish a repeatable process for reviewing call center performance, identifying gaps, and continuously improving against relevant benchmarks.
How BlueTweak Helps You Act on Call Center KPI Benchmarks
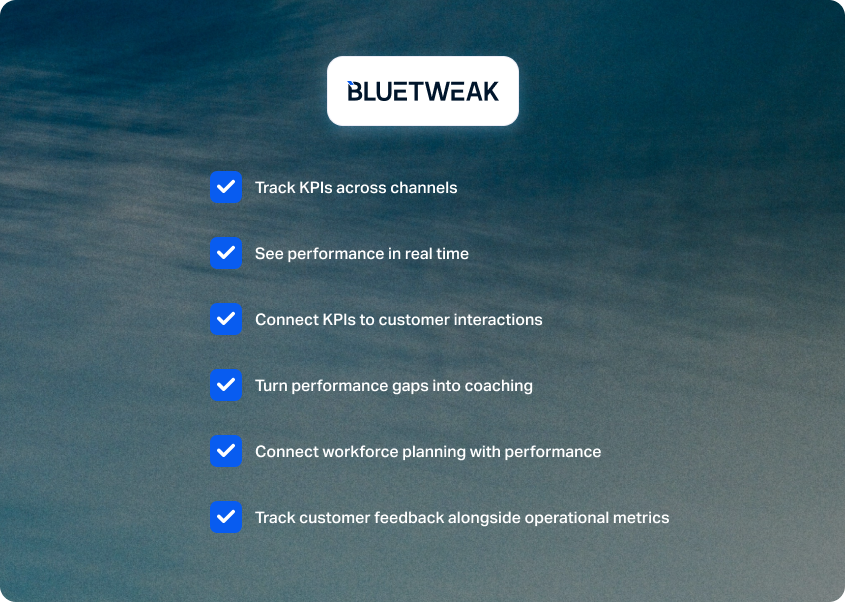
Knowing your call center KPI benchmarks is only useful if you can see where your performance stands and understand what is driving the numbers. BlueTweak brings analytics, quality assurance, workforce management, and customer feedback into one operational view, connecting performance data to the conversations behind it.
With BlueTweak, teams can:
- Track KPIs across channels: Monitor volume, outcomes, response times, resolution, and customer satisfaction across voice, email, chat, and social channels.
- See performance in real time: Live dashboards help agents and managers spot queue pressure, bottlenecks, and emerging performance issues before they become larger problems.
- Connect KPIs to customer interactions: Rather than viewing metrics in isolation, BlueTweak links analytics and QA insights to the underlying conversations, helping teams understand why performance changed.
- Turn performance gaps into coaching: Structured QA scorecards, transcripts, and coaching workflows help managers identify quality issues and act on them with agents.
- Connect workforce planning with performance: Forecasting, scheduling, and real-time workforce monitoring sit alongside analytics, giving teams a clearer view of how staffing decisions affect service levels and center performance.
- Track customer feedback alongside operational metrics: BlueTweak connects survey responses to the specific ticket, chat, or call, helping teams understand the relationship between customer satisfaction and operational performance.
The result is a more connected approach to call center benchmarking. Instead of checking whether a KPI has moved above or below a benchmark and stopping there, teams can investigate the customer interactions, staffing conditions, quality scores, and operational changes behind that movement.
Key Takeaways for Call Center Leaders
Call center KPI benchmarks are most useful when they're treated as context, not commandments. The right target for your operation depends on your customers, channels, intent mix, complexity, staffing model, and business priorities.
Keep these principles in mind when setting and reviewing your benchmarks:
- Use external benchmarks as a reference point, not a universal target.
- Compare like with like by segmenting performance by channel, intent, and interaction complexity.
- Track customer and operational KPIs together so improvements in speed or efficiency don't come at the expense of resolution or customer satisfaction.
- Define your measurement methodology before comparing results, particularly for FCR, CSAT, CES, repeat calls, and self-service containment.
- Look for trends and causes, not isolated numbers. A KPI tells you what changed; customer interaction and operational data can help explain why.
- Review your benchmarks regularly as customer expectations, call volumes, channels, staffing, and service models change.
Most importantly, don't benchmark for benchmarking's sake. The purpose of measuring center performance is to identify meaningful opportunities to improve customer experience, team performance, and operational efficiency.
Turn Call Center Benchmarks Into Better Performance
The best call center KPI benchmarks don't give you a single number to chase, they give you a reliable starting point for understanding performance and setting targets that make sense for your operation.
In 2026, that means looking beyond individual call center metrics and considering the wider customer journey. Use external benchmarks alongside your own historical data, segment results by channel and customer intent, and balance measures such as service level, FCR, CSAT, AHT, occupancy, and self-service containment.
Then turn those insights into action. When you can see which customer interactions, processes, or staffing conditions are driving a KPI, it's much easier to decide what needs to change and measure whether that change actually improves center performance.
BlueTweak gives contact center teams a connected view of analytics, QA, workforce management, and customer feedback, with performance data tied to the interactions behind it.
Ready to move from benchmark tracking to continuous improvement? Explore BlueTweak's analytics and reporting capabilities or book a demo to see how the platform can help your team turn call center KPI data into action.

As Head of Digital Transformation, Radu looks over multiple departments across the company, providing visibility over what happens in product, and what are the needs of customers. With more than 8 years in the Technology era, and part of BlueTweak since the beginning, Radu shifted from a developer (addressing end-customer needs) to a more business oriented role, to have an influence and touch base with people who use the actual technology.



